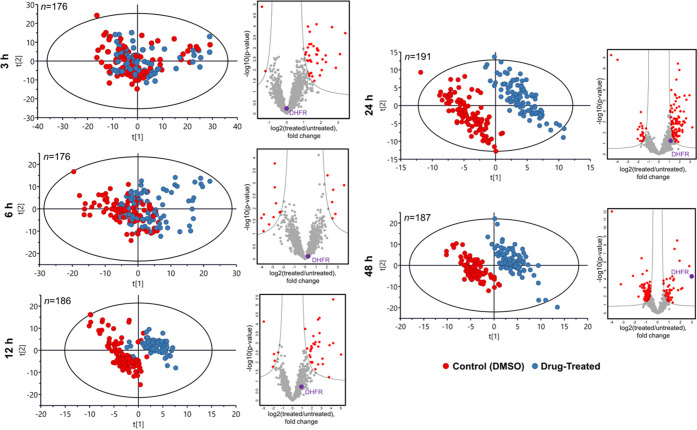
Figure 2.
Time-course results upon treatment with methotrexate. PCA plots of single-cell data as a time course demonstrating the emergence of separation between the MTX-treated and untreated attached cells with incubation time, and the corresponding volcano plots of regulated proteins showing the emergence of dihydrofolate reductase (as indicated with a purple dot and DHFR) among the top regulated proteins.

