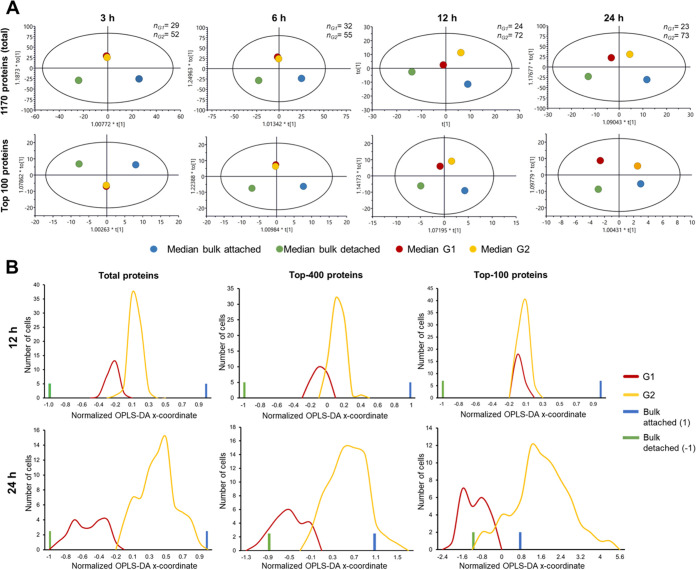
Figure 3.
Statistical analysis of single cells treated with methotrexate. (A) OPLS-DA analysis of SCCP data on median protein abundances in G1 and G2 cell groups from MTX-treated single cells at different time points together with bulk abundances for the total proteome (1170 proteins) and top 100 most abundant proteins. The numbers of single cells belonging to G1 and G2 are given at the right top of each plot. (B) Distribution of the main OPLS-DA coordinates of G1 and G2 groups of MTX-treated attached cells at 12 and 24 h past treatment for the total proteome, top 400, and top 100 proteins. The x-coordinates were normalized such that the coordinates of the attached and detached cells’ bulk-analyzed proteomes after 48 h treatment are +1 and −1, respectively.

