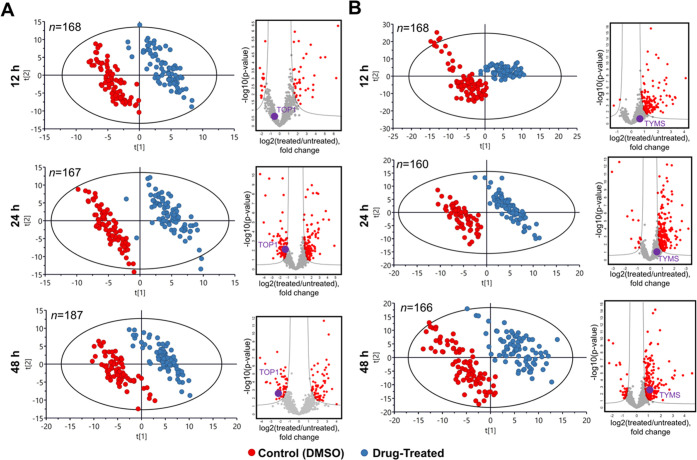
Figure 4.
Time-course results upon treatment with camptothecin and tomudex. PCA plots of SCCP data as a time course demonstrating the emergence separation between the untreated cells and the attached cells treated with (A) camptothecin and (B) tomudex with incubation time and the corresponding volcano plots of regulated proteins (as indicated with a purple dot and TOP1 or TYMS, respectively) showing the emergence of the known drug target among the top regulated proteins.

