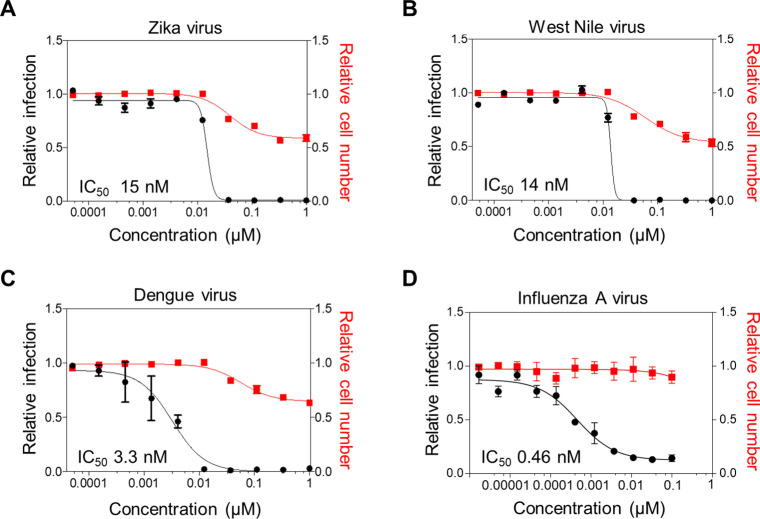
Figure 3.
Antiviral activity of Apra S4 against flaviviruses and influenza A virus. (A–C) Huh7.5 cells were seeded overnight and then treated with increasing concentrations of Apra S4 for 2 h prior to infection. Cells were then infected with (A) Zika virus/Ugandan MR766 at MOI = 0.25, (B) West Nile Virus/Kunjin isolate at MOI = 0.05, or (C) Dengue virus/16681 serotype 2 at MOI = 3 in the presence of Apra S4. (D) For influenza A virus/WSN infection, A549 cells were treated with Apra S4 for 2 h and infected at MOI = 0.1. At 24 h postinfection of flaviviruses (A–C) or 36 h postinfection of influenza virus (D), cells were fixed and infection was measured through immunofluorescence. The percentage of infection was calculated as the ratio between the number of infected cells stained for flavivirus envelope protein or influenza nucleoprotein, and the total amount of cells stained with DAPI. Dose–response curves for both infectivity (black) and cell number (red) are shown. Data represent the average ± standard deviation of infection and cell count relative to DMSO.

