Figure 1.
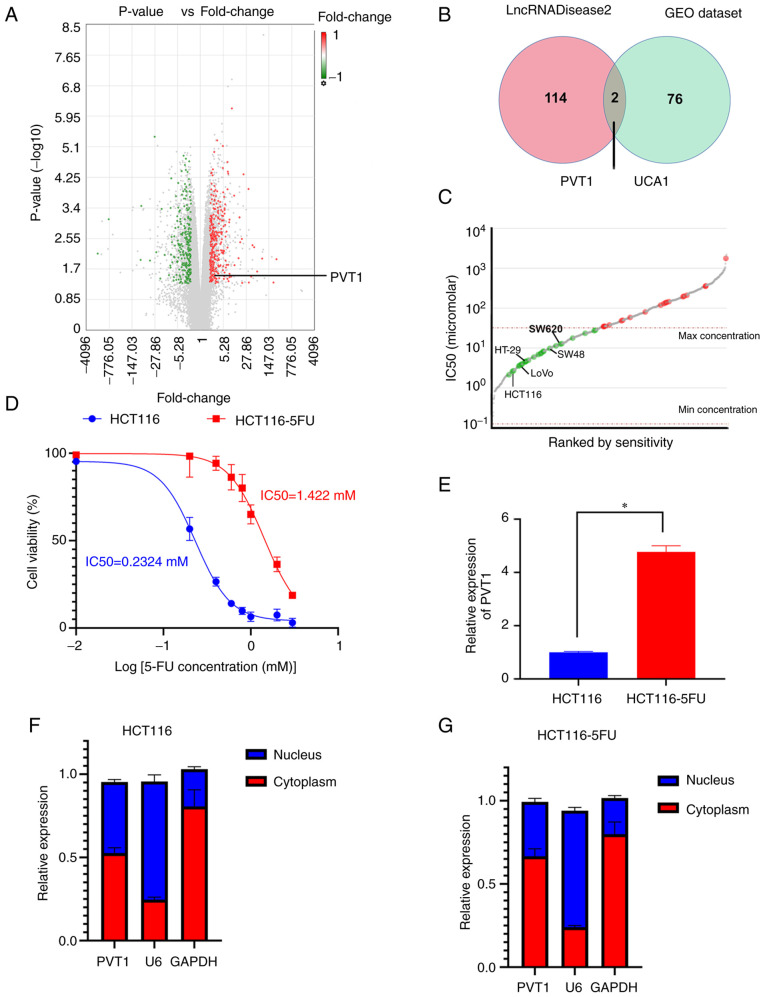
PVT1 is highly expressed in drug-resistant colorectal cancer cells. (A) Volcano plot demonstrating differentially expressed lncRNAs in colon cancer, identified in the GEO database. Green indicates downregulated lncRNAs, red indicates upregulated lncRNAs, and gray indicates non-differentially expressed lncRNAs and other types of RNAs (mRNAs and miRNAs). (B) Venn diagram illustrating the intersection of differentially expressed lncRNAs in colon cancer in the GEO database and lncRNAs related to colon cancer in the lncRNADisease2 database. (C) CCK-8 assay was used to determine 5-FU IC50 values for parental and 5-FU-resistant HCT116 cells. (D) RT-qPCR was used to quantify PVT1 expression in parental and 5-FU-resistant HCT116 cells. (E) ΡΤ-qPCR was used to detect the expression of PVT1 in the cytoplasm and nucleus of HCT116 cells. *P<0.05 (F and G) RT-qPCR was used to detect the expression of PVT1 in the cytoplasm and nucleus of HCT116 and HCT116-5FU cells. PVT1, plasmacytoma variant translocation 1; lncRNAs, long non-coding RNAs; GEO, gene expression omnibus; 5-FU, 5-fluorouracil; RT-qPCR, reverse transcription-quantitative PCR.

