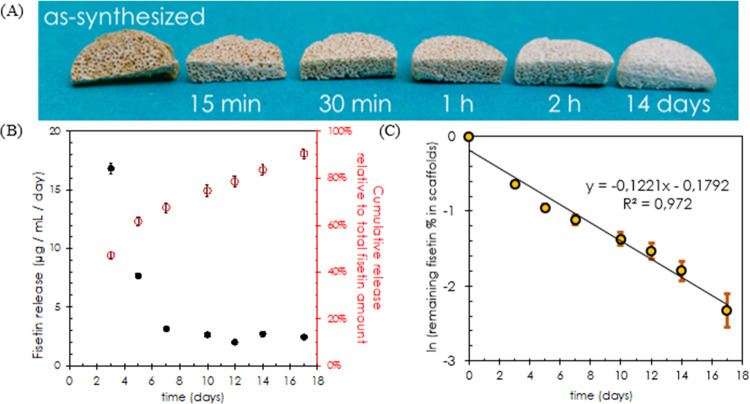
Figure 2.
(A) Optical view of BG–PCL–Fis scaffolds as a function of the immersion time in the biological medium. (B) Evolution of fisetin release from BG–PCL–Fis scaffolds normalized per day of immersion in the biological medium in the presence of rat primary osteoblast (RPO) cells (black dots) and the corresponding cumulative fisetin release relative to the total fisetin amount incorporated in the scaffold (empty red dots). (C) Napierian logarithm of the unreleased fraction of fisetin (%) versus time (days).

