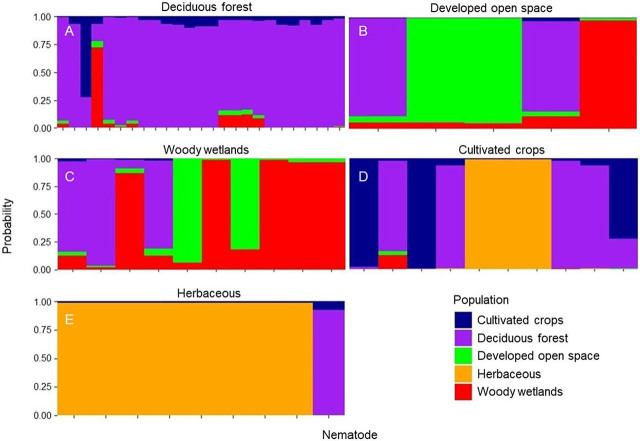
Figure 5A–E.
Stacked bar plot of the probability of each Mesocriconema xenoplax nematode to be reassigned to its respective population, defined according to land cover type; A. deciduous forest, B. developed open space, C. woody wetlands, D. cultivated crops, and E. herbaceous. Only those land cover types with ≥5 individuals were included in the analysis. The vertical axis is the probability (y-axis) of each individual (x-axis) being reassigned to its respective population, and the width of the bars depends on population size.

