Figure 5.
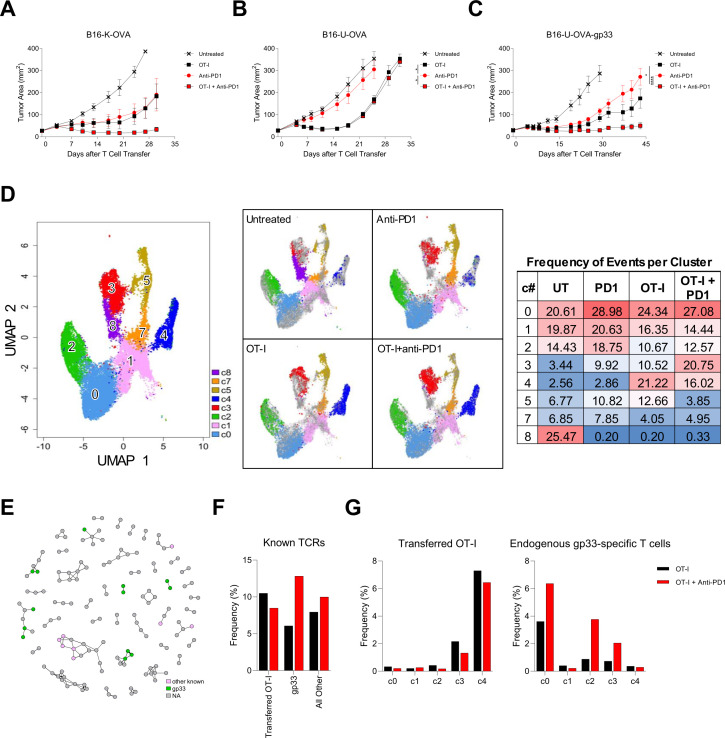
The effect of PD-1 blockade was dependent on tumor antigenicity and endogenous T cell responsiveness to PD-1 blockade. (A) Tumor response to treatment with adoptive T cell therapy with or without PD-1 blockade. C57BL/6J mice with established B16-K-OVA tumors were treated with host conditioning followed by the therapy indicated in the symbol legend. ‘OT-I’ indicates OT-I T cells. ‘Anti-PD-1’ indicated anti-PD-1 antibody. The data are represented as mean±SEM. The data shown have five mice per group and are representative of three independent experiments. (B) Tumor response to treatment with adoptive T-cell therapy with or without PD-1 blockade. C57BL/6J mice with established B16-U-OVA tumors were treated with host conditioning followed by the therapy indicated in the symbol legend. ‘OT-I’ indicates OT-I T cells. ‘Anti-PD-1’ indicated anti-PD-1 antibody. The data are represented as mean±SEM. Statistical significance was determined with a mixed model two-way analysis of variance (ANOVA) with repeated measures and * represents p<0.05. The data shown have five mice per group and are representative of three independent experiments. (C) Tumor response to treatment with adoptive T cell therapy with or without PD-1 blockade. C57BL/6J mice with established B16-U-OVA-gp33 tumors were treated with host conditioning followed by the therapy indicated in the symbol legend. ‘OT-I’ indicates OT-I T cells. ‘Anti-PD-1’ indicated anti-PD-1 antibody. The data are represented as mean±SEM. Statistical significance was determined with a mixed model two-way ANOVA with repeated measures and * represents p<0.05, **** represents p<0.0001. The data shown have five mice per group and are representative of three independent experiments. (D–G) Single-cell RNA and single-cell TCR sequencing data of T cells enriched from OT-I treated C57BL/6J mice with established B16-K-OVA-gp33 tumors. (D) UMAP clusters from all single-cell RNA-sequencing events that contain TCR sequences and exhibit CD3 expression (left). Subsets of the UMAP data for each treatment group: Untreated, Anti-PD-1, OT-I, OT-I + anti-PD-1 (middle). A heatmap of the distribution of events in these clusters for each treatment group (right). (E) Network analysis of TCR specificity groups, including subsets annotated by CDR3β sequences with specificities to defined antigens. Each dot is a TCR specificity group, and edges indicate the presence of identical CDR3β sequence(s) shared across two specificity groups. TCR specificity groups that belong to a community with at least two members are shown. (F) Percentage (frequency %) of TCRβ clonotypes with defined antigen specificities in tumors from OT-I treated and OT-I + anti-PD-1 treated groups. Other than the OT-I TCR, specificities to gp33 or all other (ovalbumin and undefined B16 melanoma tumor antigens) T-cell antigens are determined experimentally and bioinformatically with the GLIPH2 algorithm as in (E). G) Breakdown of cell states for OT-I TCR (left) and TCRβ clonotypes specific to gp33 (right) as defined in (F). PD-1, programmed cell death protein-1; TCR, T-cell receptor; UMAP, Uniform Manifold Approximation Projection.

