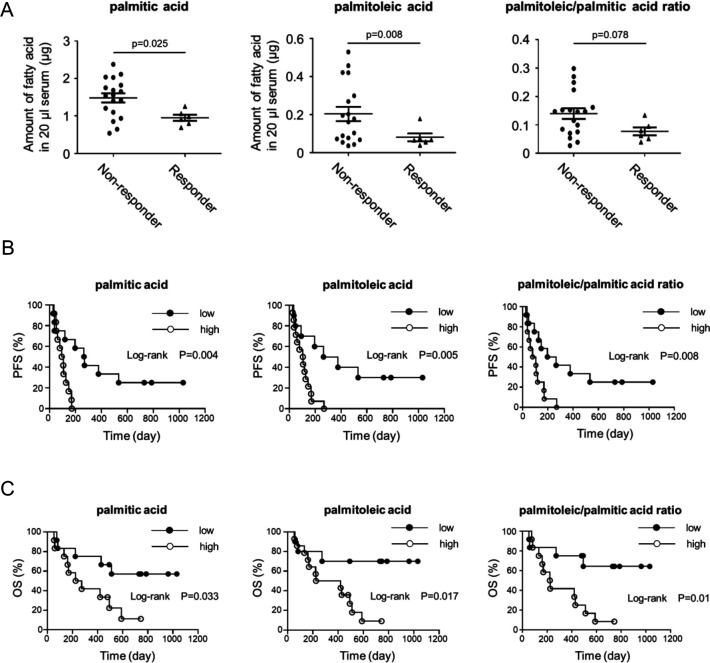
Figure 7.
SCD1-related free fatty acids and ratio are potential biomarkers to predict PD-1 antibody responses and prognosis. (A) Pretreatment serum levels of palmitic and palmitoleic acid and ratio of palmitoleic/palmitic acid from NSCLC patients who subsequently did (Responder, n=6) or did not (Non-responder, n=18) respond to anti-PD-1 antibody treatment. (B, C) Kaplan–Meier analyses of NSCLC patients before anti-PD-1 antibody treatment. Kaplan–Meier curve of high (n=12) and low (n=12) palmitic acid, palmitoleic acid and palmitoleic/palmitic acid ratio in the serum of PFS patients (B) (HR 0.34, 95% CI 0.13 to 0.85; HR 0.32, 95% CI 0.13 to 0.77; HR 0.35, 95% CI 0.14 to 0.87, respectively) or OS patients (C) (HR 0.34, 95% CI 0.12 to 0.94; HR 0.25, 95% CI 0.09 to 0.69; HR 0.25, 95% CI 0.09 to 0.71, respectively). The threshold between high and low was median (palmitic acid; 1.33, palmitoleic acid; 0.10, palmitoleic/palmitic acid ratio; 0.10).

