
Figure 10.
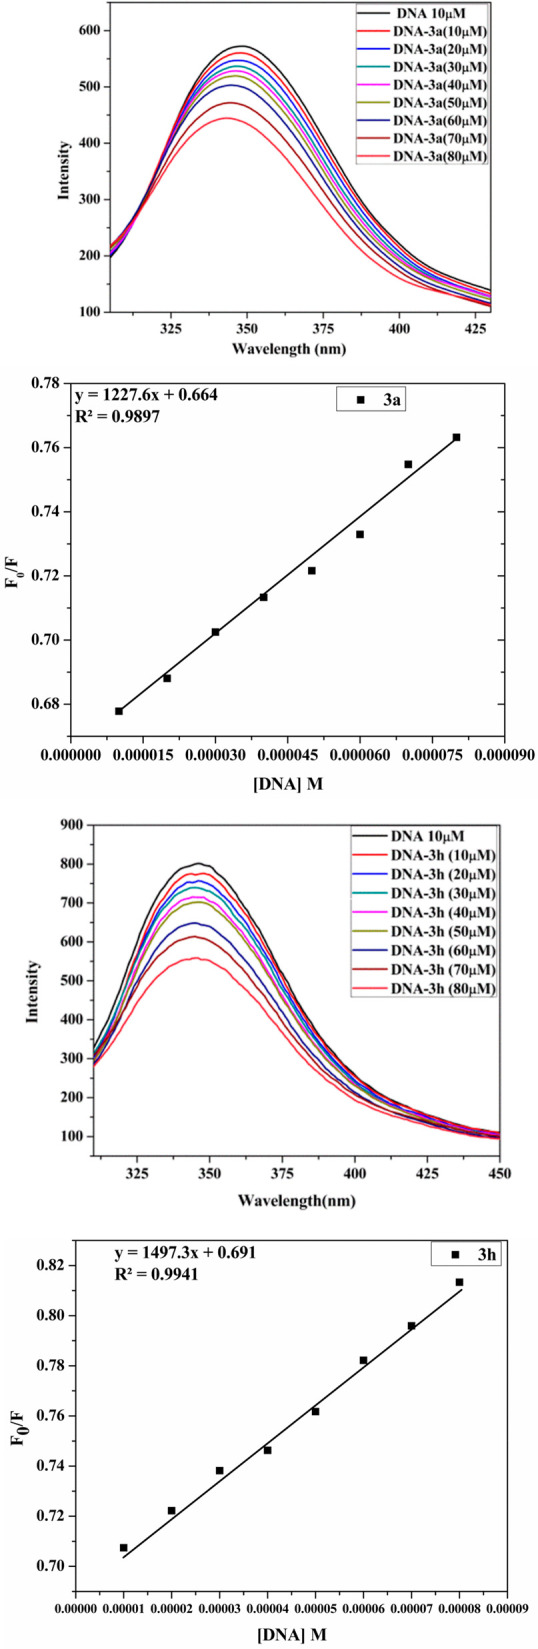
Emission titration spectra of a constant concentration of DNA (10 μM) with varying compounds 3a and 3h concentration (10–80 μM). The Stern–Volmer plot of compounds 3a and 3h.
Official websites use .gov
A
.gov website belongs to an official
government organization in the United States.
Secure .gov websites use HTTPS
A lock (
) or https:// means you've safely
connected to the .gov website. Share sensitive
information only on official, secure websites.
Emission titration spectra of a constant concentration of DNA (10 μM) with varying compounds 3a and 3h concentration (10–80 μM). The Stern–Volmer plot of compounds 3a and 3h.