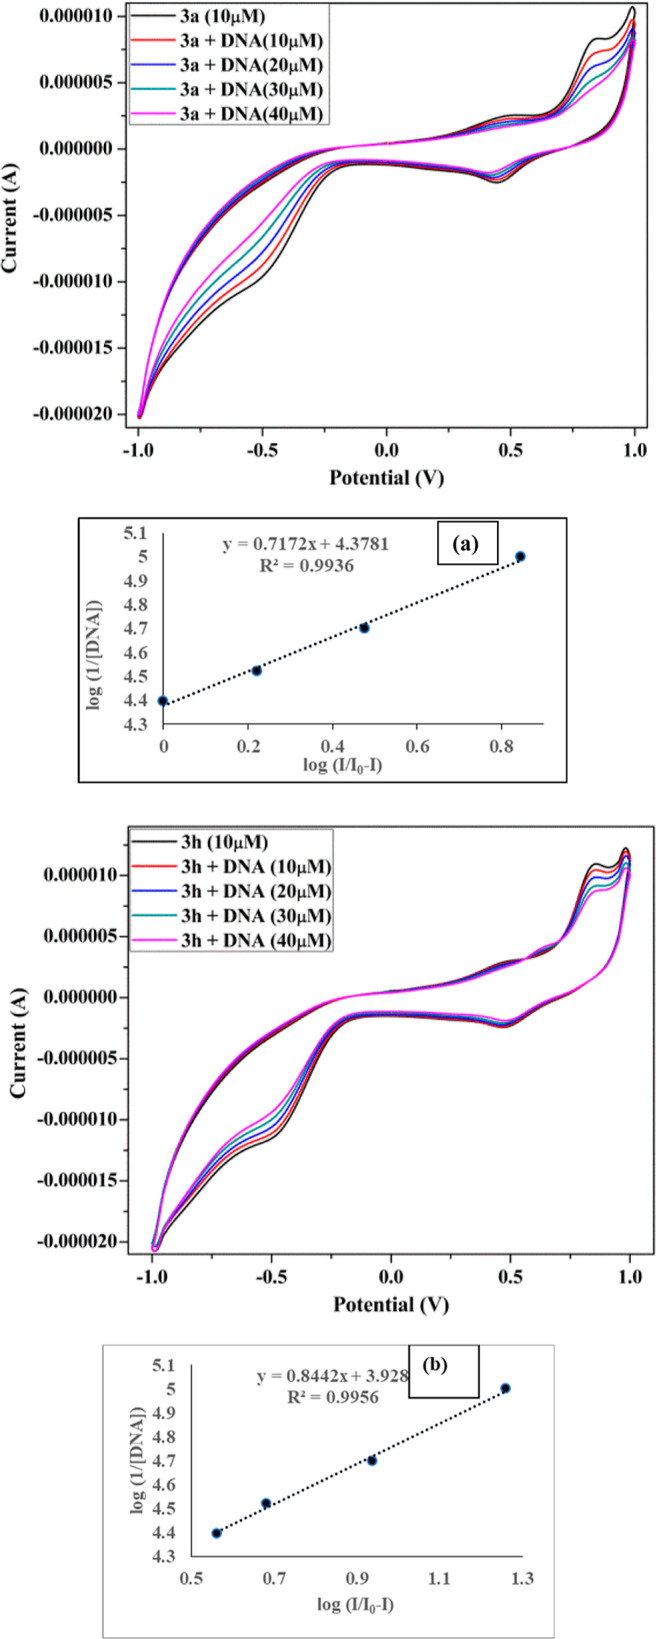
Figure 13.

Cyclic voltammogram of 1.0 × 10⁻⁵ M of analogs 3a and 3h in Tris-buffer, at 100 mV s–1 scan rate free compound (black), in the presence of DNA (10–40 μM). The plot between log(I/I0 – I) vs log(1/[DNA]) for finding binding constant value (a,b) for 3a and 3h, respectively.
