
Figure 14.
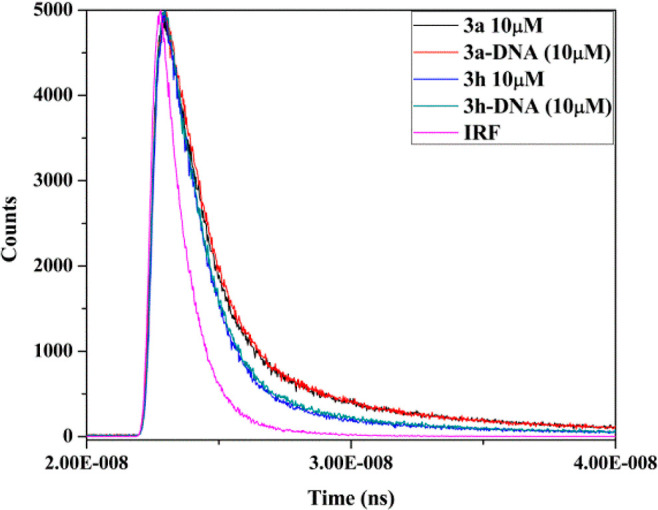
Time-resolved fluorescence graph of active compounds 3a and 3h without and with Ct-DNA and standard IRF.
Official websites use .gov
A
.gov website belongs to an official
government organization in the United States.
Secure .gov websites use HTTPS
A lock (
) or https:// means you've safely
connected to the .gov website. Share sensitive
information only on official, secure websites.
Time-resolved fluorescence graph of active compounds 3a and 3h without and with Ct-DNA and standard IRF.