
Figure 9.
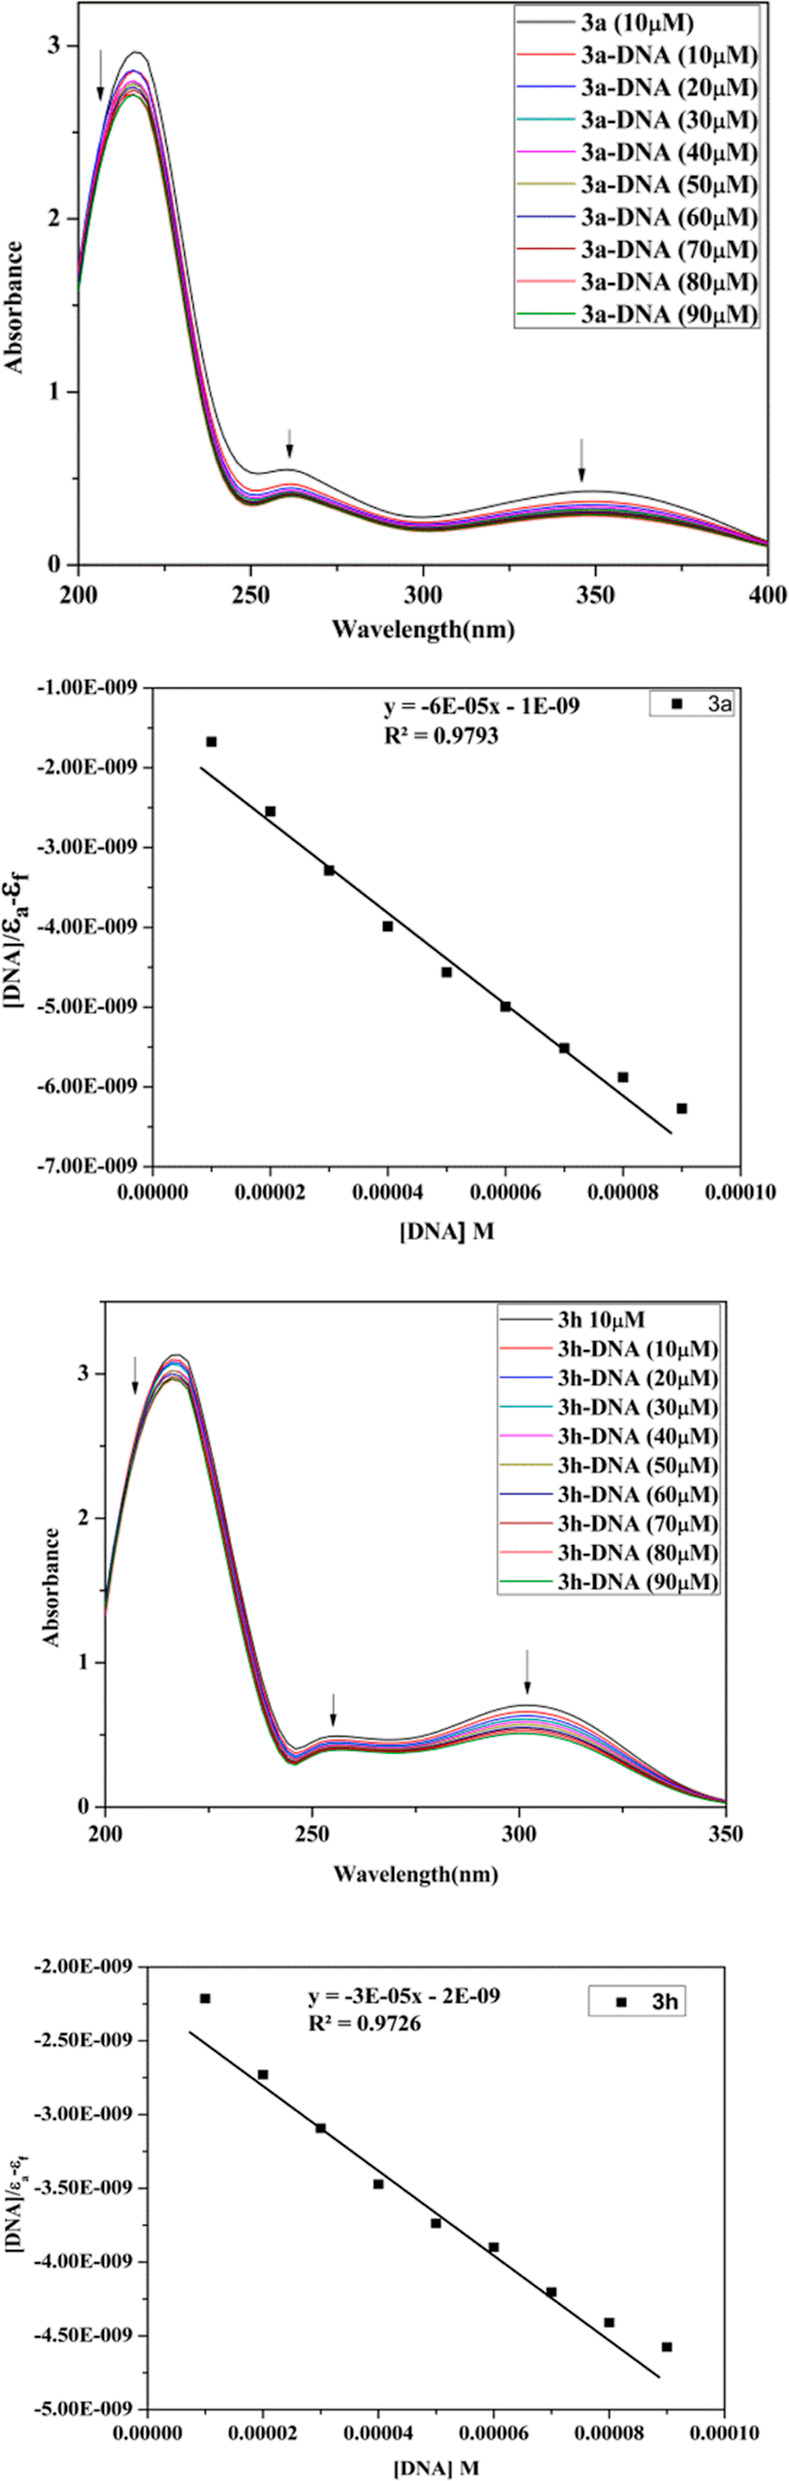
UV spectrum and inset plot between [DNA]/[εa – εf] vs [DNA] of 3a and 3h (10 μM) with increasing amount of Ct-DNA (10–90 μM).
Official websites use .gov
A
.gov website belongs to an official
government organization in the United States.
Secure .gov websites use HTTPS
A lock (
) or https:// means you've safely
connected to the .gov website. Share sensitive
information only on official, secure websites.
UV spectrum and inset plot between [DNA]/[εa – εf] vs [DNA] of 3a and 3h (10 μM) with increasing amount of Ct-DNA (10–90 μM).