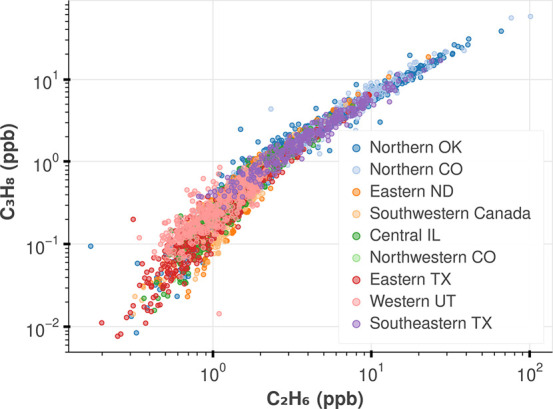
Figure 1.

Measurements of C2H6 and C3H8 from ongoing NOAA GML tower and aircraft sites (Table S1) from 2005 to 2018. The data follow the photochemical aging distribution described in Parrish et al., where the data below 1 ppb C3H8 are affected by photochemically aged emissions and mixing processes. As such, we only study the ratio of these gases in the 50th highest percentile (everything above 1 ppb C3H8) that would indicate fresh emissions. After this filtering, two sites, Northwestern CO and Western UT (site codes NWR and UTA), did not have any data in the fresh emission regime and are not included in further analysis (more detail in Figure S8).
