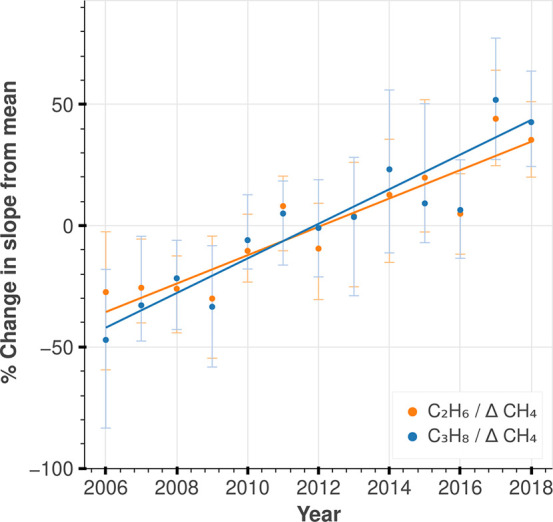
Figure 2.

Yearly correlation between NOAA hydrocarbon versus CH4 anomaly in Oklahoma. We show the percent change of anomalies/year with respect to the mean hydrocarbon and methane anomalies. The trend for C3H8/CH4 is 7.13 ± 1.44% with an R2 of 0.71. The trend for C2H6/CH4 is 5.87 ± 1.26% with an R2 = 0.69. The variability in the trend comes from the standard error of a linear regression. The variability in the individual points comes from the 95% confidence interval of a pairs bootstrap of the alkanes and CH4 anomalies. (We ran a pairs bootstrap for co-measurements of C3H8 and ΔCH4 and compute the slope of the correlation for each bootstrap sample and repeated this for every year in the data; please see the Materials and Methods section.) This trend in units of ppt/ppb/year is shown in Figure S21.
