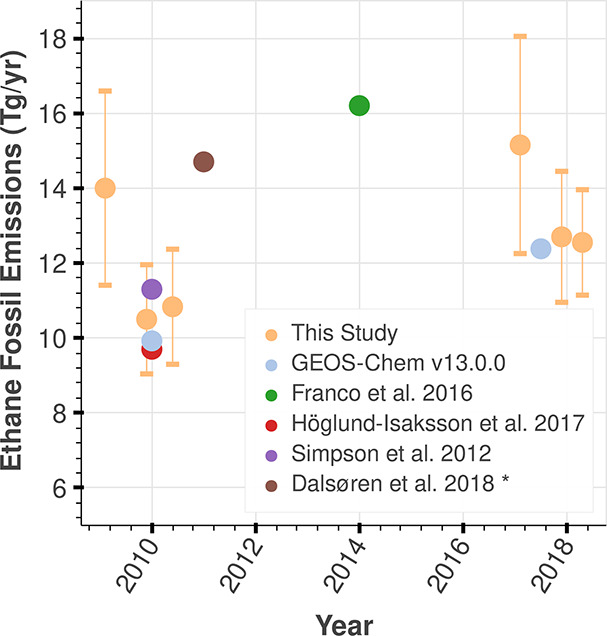
Figure 5.

Global revised ethane anthropogenic fossil emissions compared to other studies. Our emissions estimate in 2016–2018 (during ATom) and 2009–2011 (during HIPPO) includes our revised emissions for winter, fall, and spring seasons that we determined with our Bayesian model during each season. As discussed in the text, fewer samples were obtained during HIPPO, resulting in a sampling bias that we test by restricting observations and simulations to ±300 K potential temperature (Figures S56 and S57). This test affects the estimate about ±1 Tg during 2010–2011 but affects our estimate by up to 12 Tg in 2009. We compare our revised emissions to the default emissions from GEOS-Chem v13.0.0. The studies included here23,25−27 represent anthropogenic fossil emissions, except for the work by Dalsøren et al., which also includes biofuel, agriculture, and waste. We obtained the CEDS CMIP6 estimate from Dalsøren et al. Our emissions estimates do not include biomass burning or biofuels. Propane emissions are included in Figure S62.
