
Figure 6.
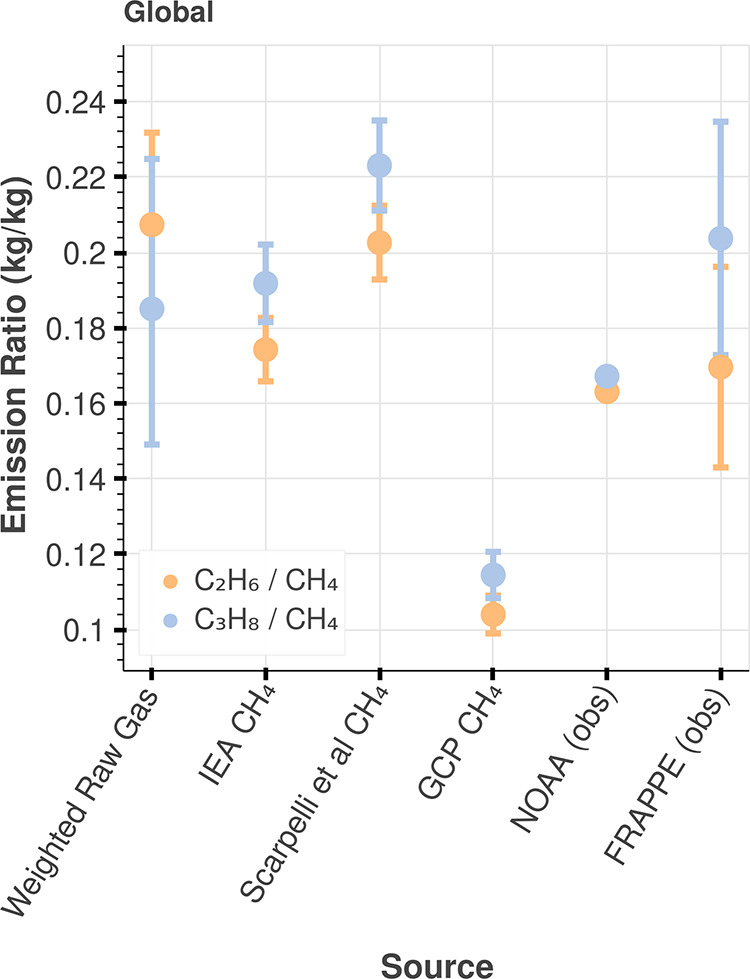
Global literature and observationally informed emission ratios (OIER) C3H8/CH4 and C2H6/CH4. The “weighted raw gas ratio” in the figure represents the “literature ratio” described in the text, calculated using eq 2. OIER, ratios between our revised C2H6 and C3H8 emissions and literature CH4 emission estimates, are shown for several literature CH4 estimates, including IEA (76.4 Tg/year),34 Scarpelli et al. (65.7 Tg/year),33 and Global Carbon Project bottom-up estimate (128 Tg/year, 2008–2017 average).32 The variability in the literature ratio is attributed to the 95% CI of pairs bootstrap samples of hydrocarbon composition measurements (see text for more detail). The variability in the OIER is attributed to the 95% CI of our revised C3H8 and C2H6 emission estimates. We also compare C3H8/CH4 and C2H6/CH4 correlations from in situ observations, including NOAA observations from Northern Oklahoma (2017 average from Figure S21, units of kg/kg) and FRAPPE observations from Northern Colorado (2014 from Figure S9, units of kg/kg). The variability in the NOAA ratio is relatively low because it is calculated from a multiyear average slope, and the error in the slope is low (see Figure S21, left). The variability in the FRAPPE ratio is relatively high because we use the 95% CI derived directly from our bootstrap samples, as described in the Materials and Methods section.