Figure 1.
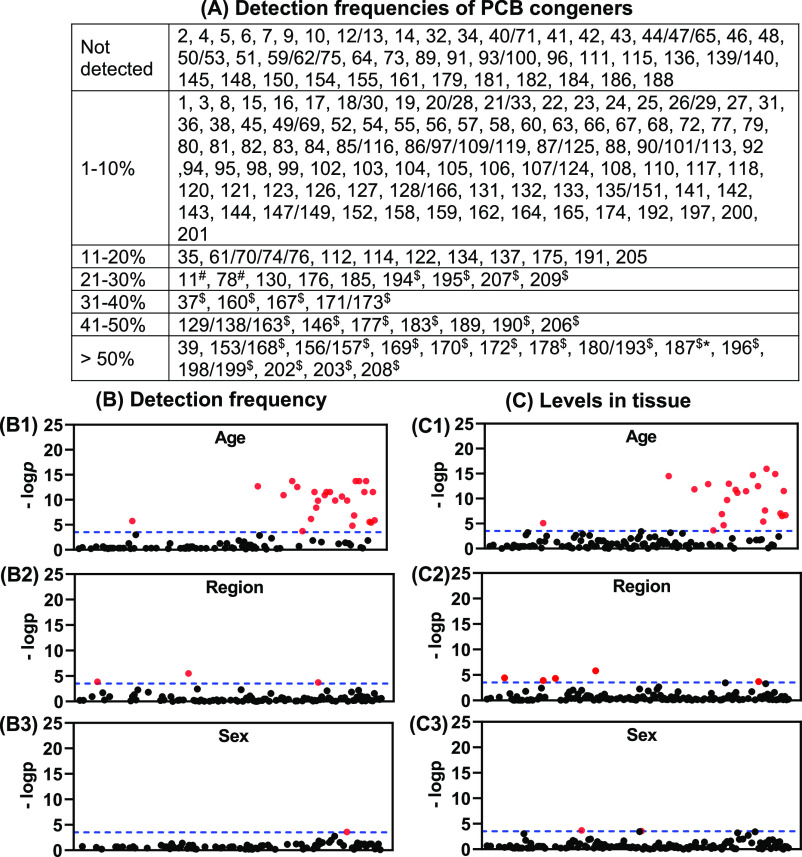
(A) Detection frequencies of PCB congeners reveal age- and brain region-dependent differences. Plots of p-values comparing detection frequencies (B) and levels (C) of single or co-eluting PCB congeners between two age groups (B1 and C1), seven brain regions (B2 and C2), and two sex groups (B3 and C3) also show significant differences based on age, brain region, and sex. The dotted line indicates the—log p values of Bonferroni-adjusted multiple comparisons (p = 2.89 × 10⁻⁴). Detection frequencies were determined in 63 tissue samples from seven brain regions for all 209 PCB congeners, analyzed as 173 peaks of single or co-eluting congeners. Red dots in panels (B,C) indicate PCB congeners with a significant difference. PCB congeners are plotted on the x-axis in the order of their Ballschmiter and Zell number, as defined by the EPA.52 Congeners with p = 1 were not plotted. The p values of the corresponding PCB congeners are presented in Table S15 and are significant different (p < 2.89 × 10⁻⁴) between age groups ($), across brain regions (#), and between sex groups (*).

