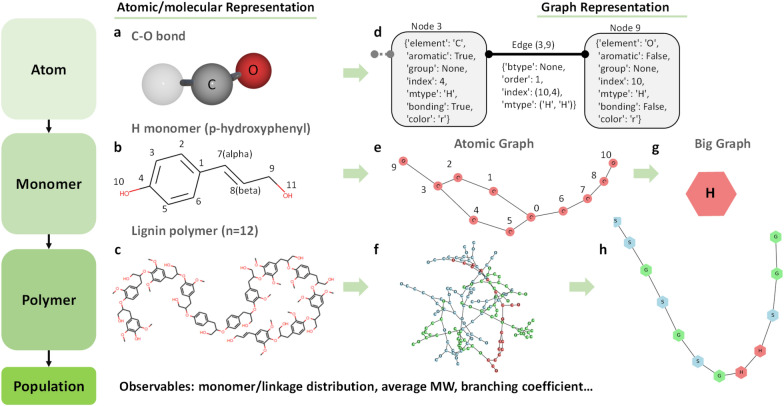
Fig. 2.
Multiscale modeling framework in LigninGraphs. Lignin structures are modeled at multiple scales (atom, monomer, polymer, and population). The left column shows the atomic or molecular representations for a a C–O bond, b an H monomer with C and O atom indices, and c a lignin polymer of 12 monomers. The right column shows the corresponding structures as atomic graphs (d–f) and big (coarse-grained) graphs (g, h). d Building blocks in atomic graphs: each C or O atom is a node, and each bond is an edge in the graph with properties saved in a dictionary format. e Atomic graph for an H monomer with node index for each C or O atom (note that the node index starts from 0 and the atom index starts from 1, i.e., the node index is equal to the corresponding atom index minus 1). In this example, node 3 is the 4th C atom and node 9 is the 10th O atom in an H monomer. They are connected by a single bond (order = 1) edge (3, 9). f Atomic graph for the lignin polymer in (c). g Big graph for an H monomer. h Big graph for the lignin polymer in (c): each monomer is a node, and each linkage is an edge. H, G, and S monomers and the atoms belonging to each type are marked in red, green, and blue, respectively

