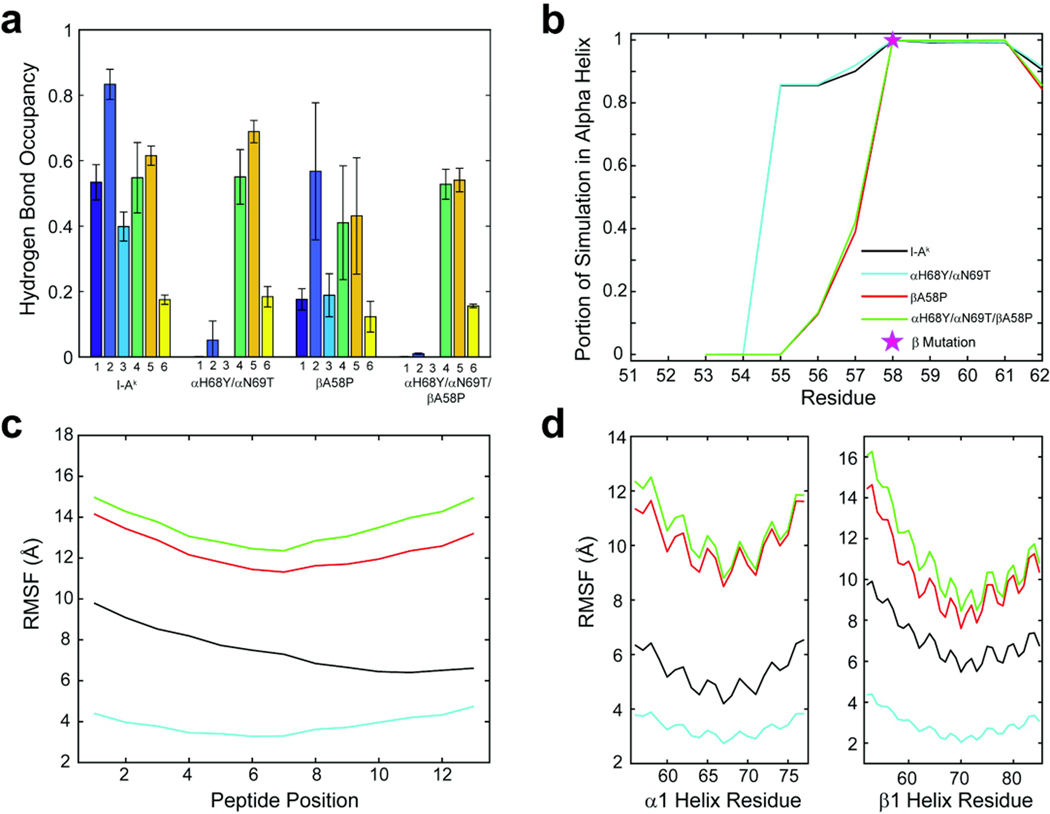
Figure 4. Polymorphisms that distinguish I-Ak from I-As impact peptide-protein hydrogen bonds and α helix character.
Average occupancy of hydrogen bonds 1–6 as indicated in Fig. 3 between residues α68 and α69, and the peptide backbone. Bars are shown as the mean occupancy over the course of simulations and error bars are the population standard deviation between the three replicate simulations for each variant. Hydrogen bonds are denoted by a number on the x-axis, which corresponds to the labels in Figure 3.

