
Fig. 1.
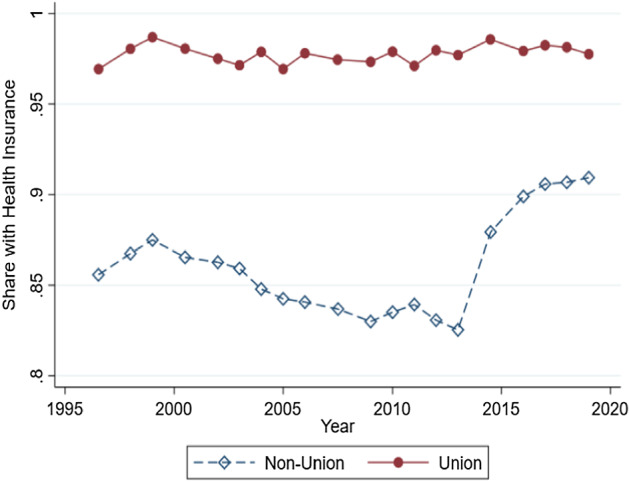
Health Insurance Coverage by Union Status, 1996–2019 Figure presents a binned scatterplot of health insurance coverage by union status for employed workers for the entire sample period. Observations weighted by IPUMS-MEPS sample weights
Official websites use .gov
A
.gov website belongs to an official
government organization in the United States.
Secure .gov websites use HTTPS
A lock (
) or https:// means you've safely
connected to the .gov website. Share sensitive
information only on official, secure websites.
Health Insurance Coverage by Union Status, 1996–2019 Figure presents a binned scatterplot of health insurance coverage by union status for employed workers for the entire sample period. Observations weighted by IPUMS-MEPS sample weights