FIGURE 1.

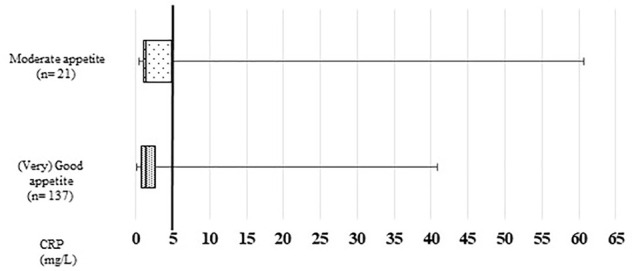
Participants’ CRP (C-reactive protein) levels according to appetite. Comparison between the groups, Mann-Whitney-U-test, p = 0.296.

Participants’ CRP (C-reactive protein) levels according to appetite. Comparison between the groups, Mann-Whitney-U-test, p = 0.296.