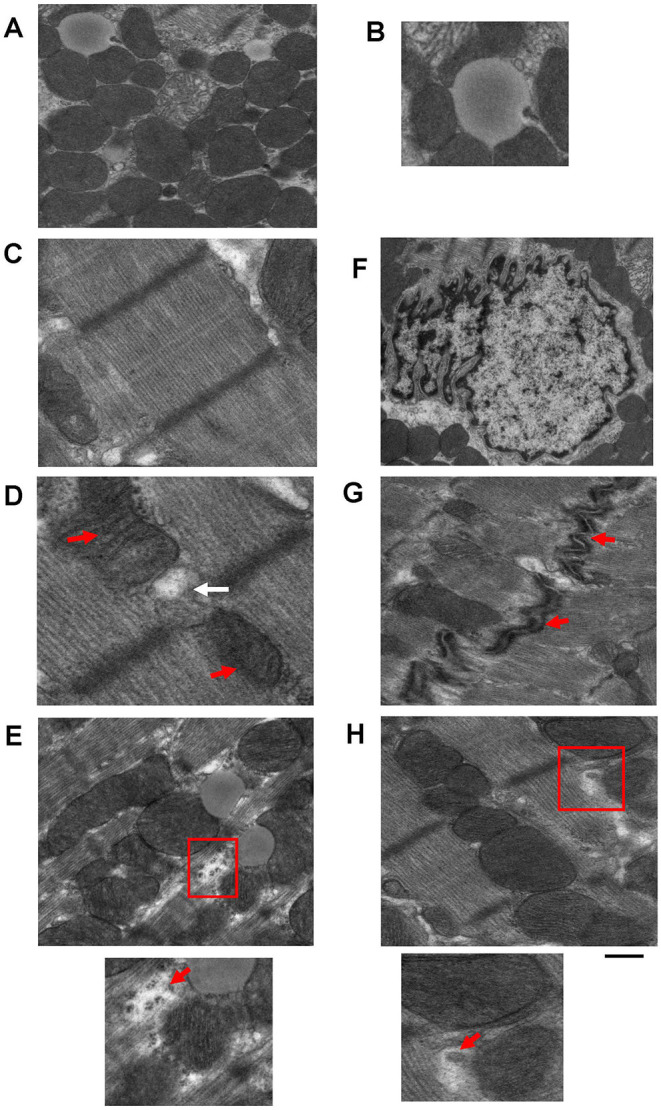
Figure 2.

Example images of cardiac cellular structures examined using TEM studies from wild-type mouse hearts. (A) TEM image showing mitochondria surrounding a lipid droplet; (B) Magnification of Lipid droplet in (A); (C) TEM image of cardiac sarcomeric structure; (D) TEM image of SR-mitochondria connections. Red arrows depict mitochondria and white arrow depicts SR; (E) TEM image showing glycogen deposits (highlighted in red box); (F) TEM image of a nucleus; (G) TEM image of gap junctions (gap junctions depicted by red arrows); and (H) TEM image showing a mitochondrial derived vesicle budding from larger mitochondria (highlighted by red box). Images are unpublished images from Zhang lab studies. Scale bar depicts 500 nm.
