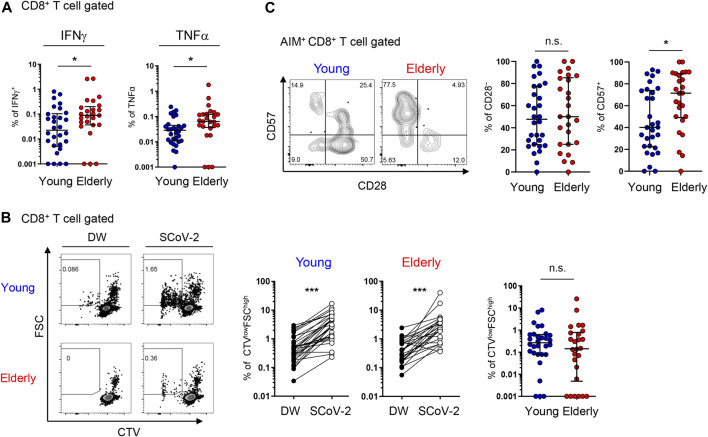
FIGURE 6.
SARS-CoV-2-specific cytokine production and proliferation from young and elderly CD8+ T cells. PBMCs from the young (n = 30) and elderly (n = 25) cohorts were stimulated and cultured with the SARS-CoV-2 peptide pool (SCoV-2) or negative control (DW) and analyzed after 6 days. One sample from the elderly cohort was excluded because of the low number of PBMCs obtained. (A) Percentages of IFNγ+ and TNFα+ cells in CD8+ T cells from the young (blue circles) and elderly (red circles) cohorts. Data were background subtracted against DW and are shown as the median ± IQR. (B) Representative flow cytometry (FCM) plots showing CTV and FSC gating of total CD8+ T cells. Boxed gates define CTVlowFSChigh cells (left). Percentages of CTVlowFSChigh T cells in CD8+ T cells between the DW and SARS-CoV-2 peptide pool stimulation in young and elderly cohorts. (middle). Percentages of CTVlowFSChigh T cells in CD8+ T cells. Data were background subtracted against DW and are shown as the median ± IQR (right). (C) Representative FCM plots showing the expression of CD57 and CD28 in AIM+ CD8+ T cells in the AIM assay. Numbers indicate percentages in the drawn gates (left). Percentages of CD28− and CD57+ cells in SARS-CoV-2-specific AIM+ CD8+T cells from young and elderly cohorts. Data are shown as the median ± IQR (right). (A-C) Each red or blue dot represents one donor. Pairwise comparisons were performed using Wilcoxon’s test. Statistical comparisons across cohorts were performed using the Mann-Whitney test. *p < 0.05, ***p < 0.001. n.s., not significant. See Supplementary Figure 6.

