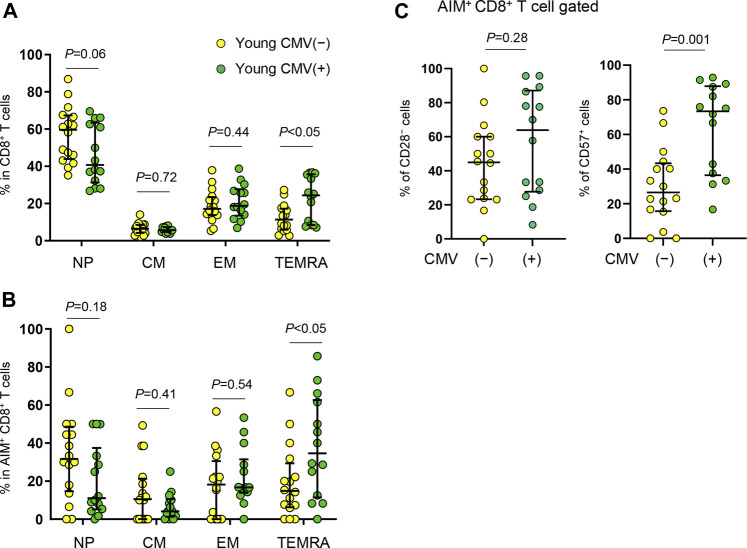
FIGURE 7.
Immunophenotyping of SARS-CoV-2-reactive CD8+ T cells from young CMV+ or CMV− individuals. (A,B) Percentages of NP, CM, EM and TEMRA cells in total CD8+ (A) or in SARS-CoV-2-reactive AIM+CD8+ T cells (B) from CMV seronegative (CMV(−)) and CMV seropositive (CMV(+)) individuals. (C) Frequency of CD28− and CD57+ cells among SARS-CoV-2-specific AIM+CD8+ T cells from CMV+ (n = 14) and CMV− (n = 16) individuals. Each dot represents one donor. Data are shown as the median ± IQR. Statistical comparisons across cohorts were performed using the Mann-Whitney test.

