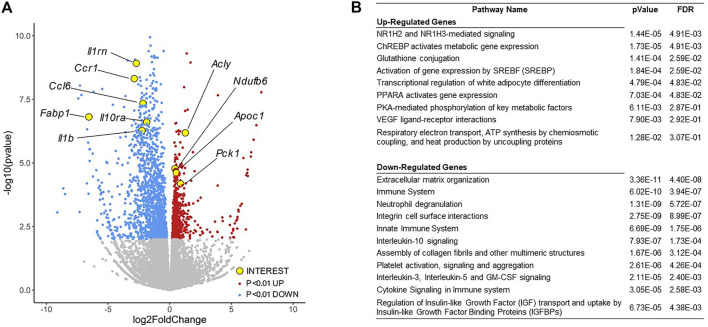
FIGURE 4.
RNA-sequencing Analysis of Gene Expression Changes in the aPU.1KO Mice. (A) Volcano plot showing gene expression changes in adipocytes isolated from the gonadal adipose tissue, with key genes of interest highlighted in yellow. (B) Gene ontology analysis of differentially expressed genes (p < 0.01) showing highly enriched pathways. The false discovery rate (FDR) is used for multiple hypothesis testing, with a standard cutoff of FDR<0.05 for significant pathway enrichment.

