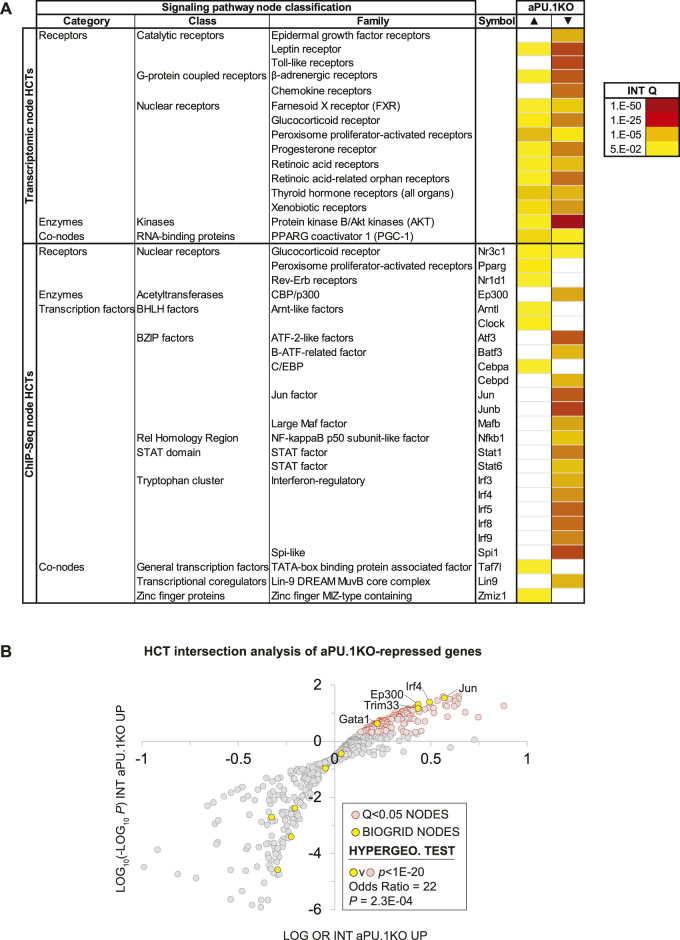
FIGURE 5.
High Confidence Transcriptional Target (HCT) Intersection Analysis Identifies PU.1-Modulated Metabolic and Inflammatory Transcriptional Regulatory Hubs. (A) HCT intersection Q-values (INT Q) for selected signaling pathway nodes or node families are indicated in the form of a heatmap. HCT intersection analysis was carried out as described in the Methods section. White cells represent Q > 5E-2 intersections. The intensity of the color scheme is proportional to the confidence of the intersection between high confidence transcriptional targets (HCTs) for a particular node and either (i) aPU.1KO-induced (▲) or (ii) aPU.1KO-repressed (▼) gene sets. Lower confidence (smaller Q) intersections are towards the yellow end of the spectrum and higher confidence (larger Q) intersections are towards the red end of the spectrum. Full numerical data are in Supplementary Table S2. (B) Scatterplot showing enrichment of known BioGRID-curated PU.1 interacting nodes among nodes that have the most significant intersections with aPU.1KO-repressed genes. Refer to the text for details.

