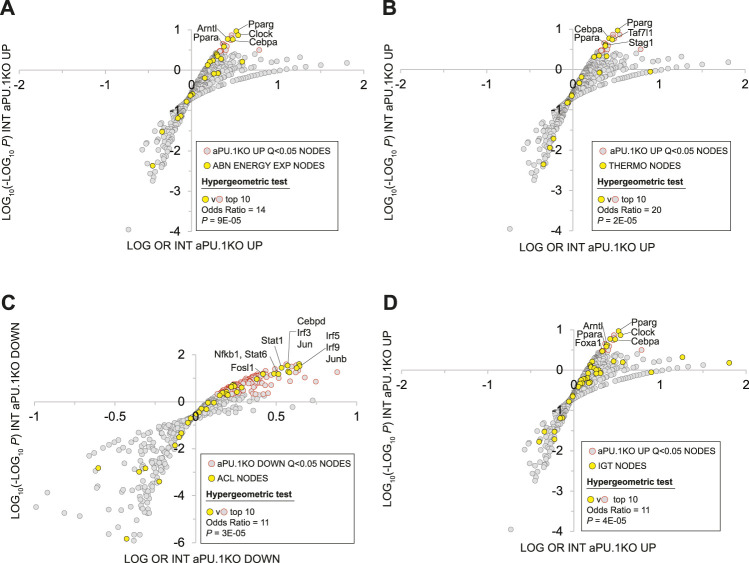
FIGURE 8.
Mammalian Phenotype Ontology Analysis Of Nodes With Significant HCT Intersections With aPU.1KO-Induced and Repressed Gene Sets. (A) Enrichment of nodes encoded by genes that map to the MPO term “abnormal energy expenditure” (AEE) among nodes that have significant HCT intersections with aPU.1KO-induced genes. (B) Enrichment of nodes encoded by genes that map to the MPO terms “decreased brown adipose tissue amount”, “decreased core body temperature” or “impaired adaptive thermogenesis” (collectively referred to as THERMO genes) among nodes that have significant HCT intersections with aPU.1KO-induced genes. (C) Enrichment of nodes encoded by genes that map to the MPO term “abnormal cytokine levels” (ACL) among nodes that have significant HCT intersections with aPU.1KO-repressed genes. (D) Enrichment of nodes encoded by genes that map to the MPO term “impaired glucose tolerance” (IGT) among nodes that have significant HCT intersections with aPU.1KO-induced genes. Please refer to the Methods for details of the analysis.

