
FIGURE 6.
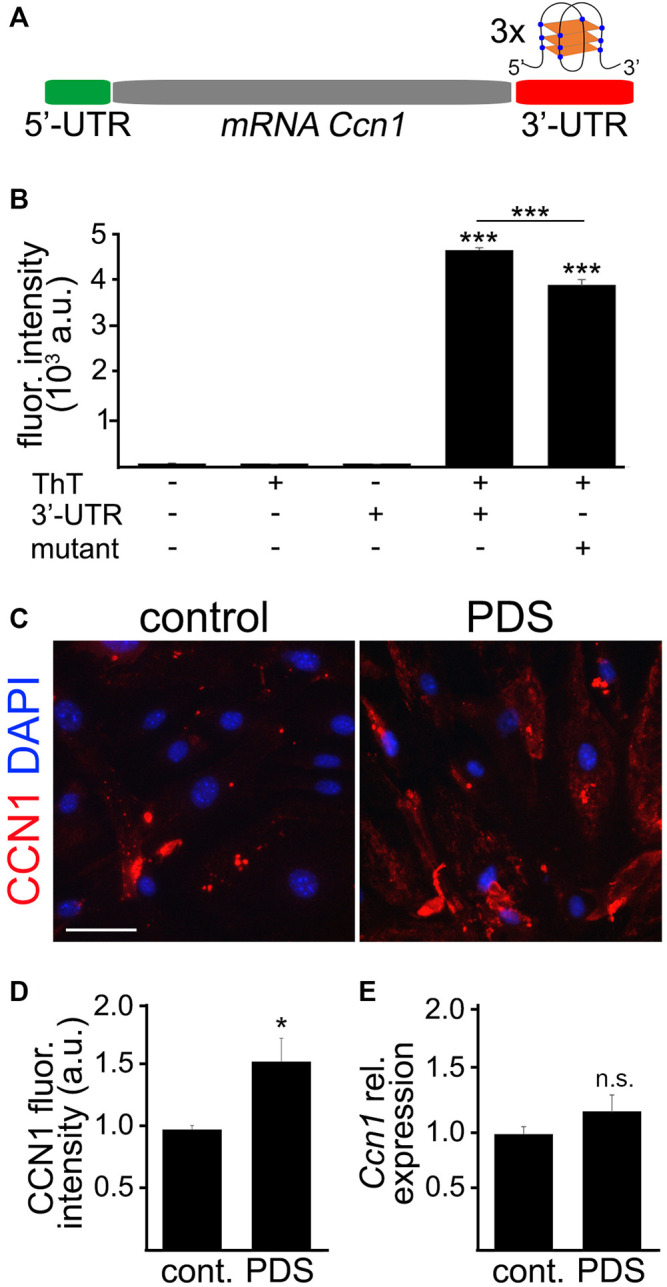
The 3′-UTR Ccn1 mRNA folded into G4s. (A) Scheme of the mRNA Ccn1 where the 5′-UTR (green) does not contain any potential G4 motif, and the 3′-UTR (red) contains three potential G4 motifs. In the representation of a RNA G4 structure, blue dots indicate Gs and orange rectangles indicate planar rearrangements between Gs. (B) The RNA sequence containing the potential G4 in the 3′-UTR Ccn1 near the stop codon (3′-UTR) or the RNA sequence containing the 3′-UTR Ccn1 with a single mutation (mutant), as a negative control, were incubated at 90°C for 2 m, and cooled down at room temperature for 2 h. Then, the annealed RNA 3′-UTR and mutant sequences were mixed with a Thioflavin T (ThT) solution, and the fluorescence emission was measured. As controls we used the buffer alone, a ThT solution alone, and the 3′-UTR sequence alone. One-way ANOVA, ***p-value < 0.0001. Data were collected from four independent experiments. (C) CEC isolated from aged (18–20 m/o) female mice and cultured were treated with pyridostatin (0.5 µM), or a vehicle (water), for 4 days. CEC were fixed and stained with antibodies against CCN1 and with the nuclear Hoechst dye (DAPI channel). Scale bar, 50 µm. (D) Quantification of the fluorescence intensity of CCN1 from (C). t-test, *p-value = 0.0103. Data were pooled from three independent experiments analyzing 20 microscopic fields per condition and experiment. (E) CEC isolated from aged (18–20 m/o) female mice and cultured were treated with pyridostatin (0.5 µM), or a vehicle, for 4 days. RNA was isolated and qPCR was performed for the relative expression of Ccn1. We used Gapdh as a housekeeping gene. t-test, n.s., non-significant, p-value = 0.2424. Data were pooled from four independent experiments.