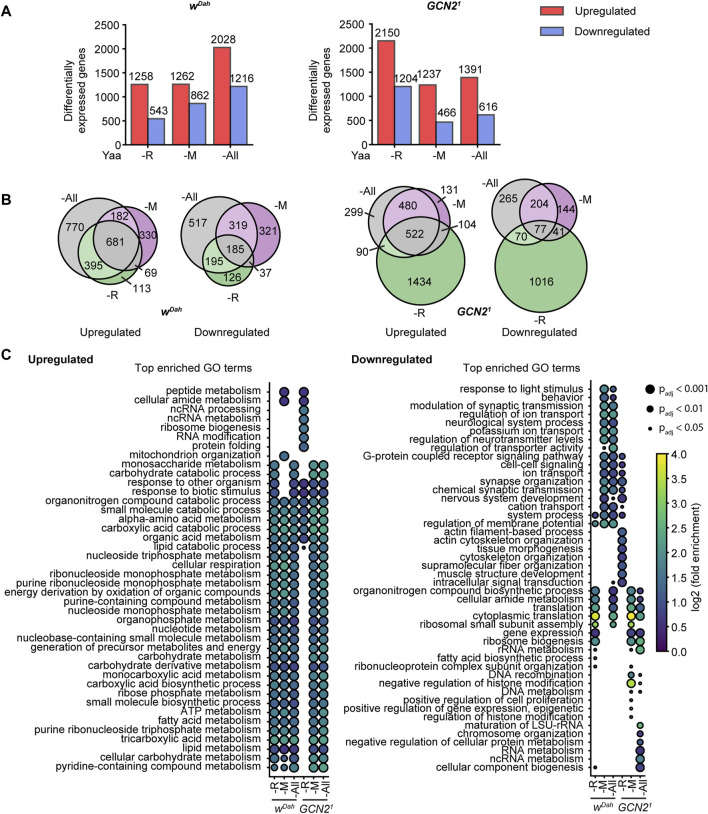
FIGURE 6.
Transcriptional profiling of wild type and GCN2 mutants under amino acid deprivation. (A) Barplot representation of differentially expressed genes (DEGs) in w Dah control (left) and Gcn2 1 mutant females (right) under -R, -M, and -All deprivation relative to the Yaa control diet. The exact number of DEGs for each diet is indicated above the bar. (B) Venn representation of gene set overlaps of DEGs in the w Dah controls (left) and GCN2 1 mutants (right) under -R, -M, and -All deprivation. (C) Dotplot representation of significantly enriched top GO terms sorted by adjusted p-value of up and downregulated genes in each genotype and diet. n = 3 replicates per genotype and diet.

