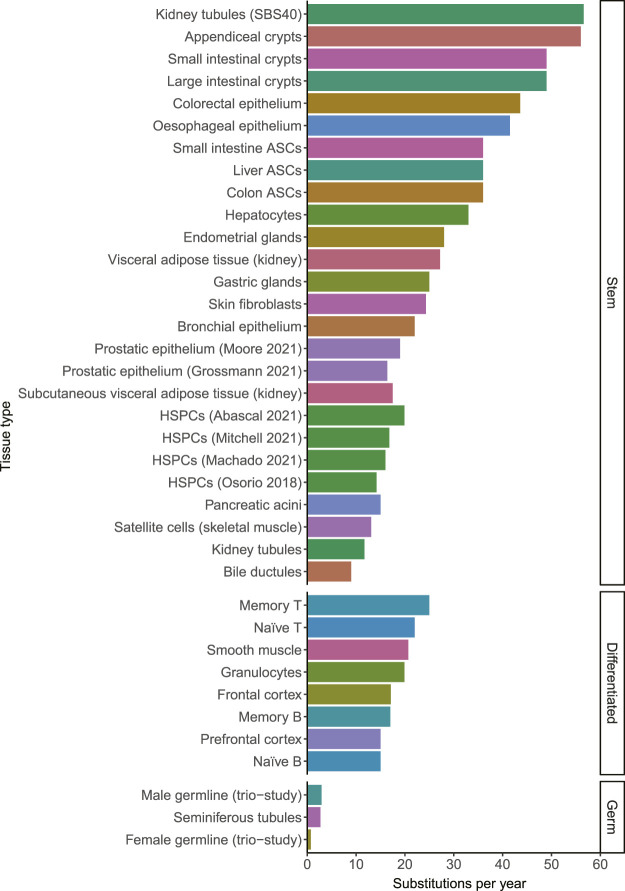
FIGURE 1.
The number of substitutions per year for different tissue types. When the mutation rate of a tissue has been determined multiple times, they are distinguished by the last name of the first author and the publication year. The color indicates the tissue type. The mutation rates in this figure may be influenced by technical differences between the studies, which may explain some of the small differences between tissues. HSPCs; Hematopoietic stem and progenitor cells. ASCs; adult stem cells. Source of mutation rates: Kidney tubules, Subcutaneous visceral adipose tissue (kidney) and Visceral adipose tissue (kidney) (Franco et al., 2019). Appendiceal crypts, small intestinal crypts, large intestinal crypts, gastric glands, pancreatic acini, bile ductules and seminiferous tubules (Moore et al., 2021). Colorectal epithelium (Lee-Six et al., 2019) Esophageal epithelium (Yokoyama et al., 2019). Small intestine ASCs, liver ASCs and colon ASCs (Blokzijl et al., 2016). Hepatocytes (Brunner et al., 2019). Endometrial glands (Moore et al., 2020). Skin fibroblasts (Park et al., 2021). Bronchial epithelium (Yoshida et al., 2020). Prostatic epithelium (Grossmann et al., 2021; Moore et al., 2021). HSPCs (Osorio et al., 2018; Abascal et al., 2021; Machado et al., 2021; Mitchell et al., 2021). Satellite cells (Franco et al., 2018). Memory T, Naïve T, Memory B, Naïve B (Machado et al., 2021). Smooth muscle, granulocytes, Frontal cortex (Abascal et al., 2021). Prefrontal cortex (Luquette et al., 2021). Male and female germlines (Jónsson et al., 2017).

