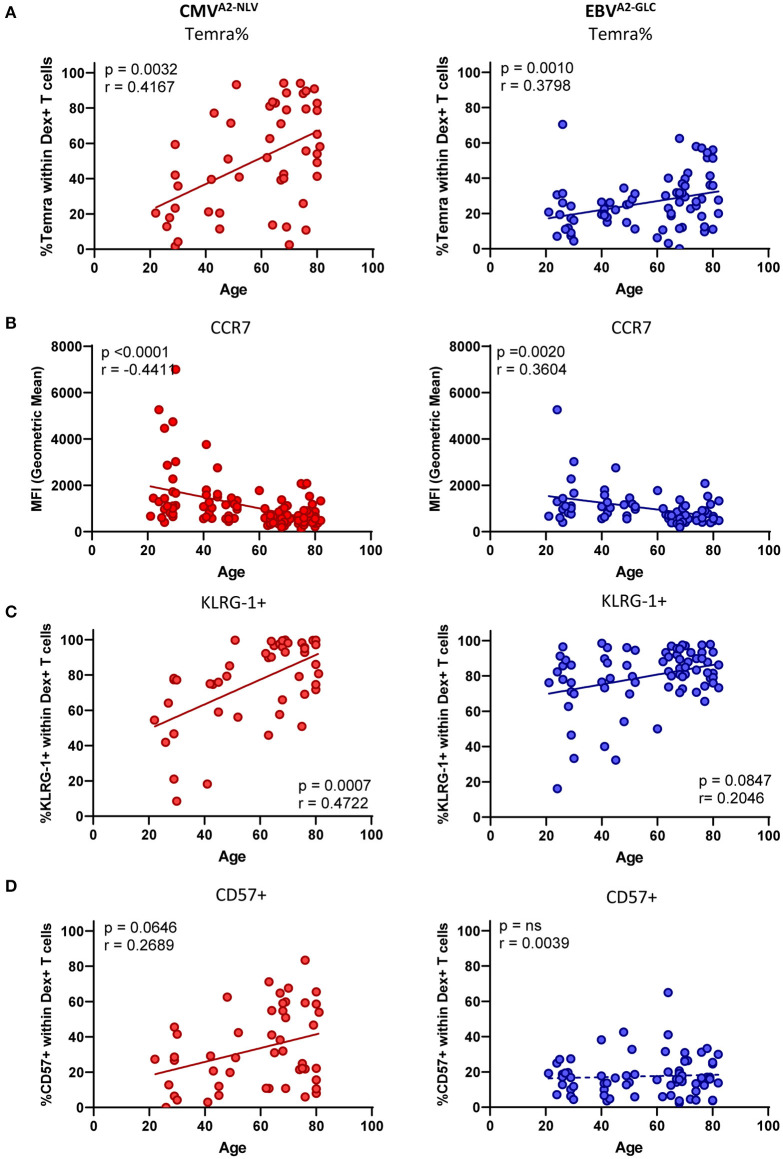
Figure 2.
The phenotype of CMV-specific and EBV-specific T cells is affected differently by age. (A–D) Phenotype analysis of both CMVA2−NLV-specific (red) and EBVA2−GLC-specific CD8+ T cells (blue) plotted against age. (A) Percentage of Temra cells (CD27–, CD45RO–). (B) Geometric Mean of the fluorescent intensity of CCR7. Percentage of KLRG-1+ (C) and CD57+ (D) within Dextramer+ CD8+ T cells. Solid lines indicate a slope significantly (p < 0.05) different from a slope of 0, whereas a dotted line indicates no significant difference. Only donors with a sufficient T-cell response (at least 25 cells) were used for the phenotypical staining. Correlations were tested with Spearman's rank correlation coefficient.

