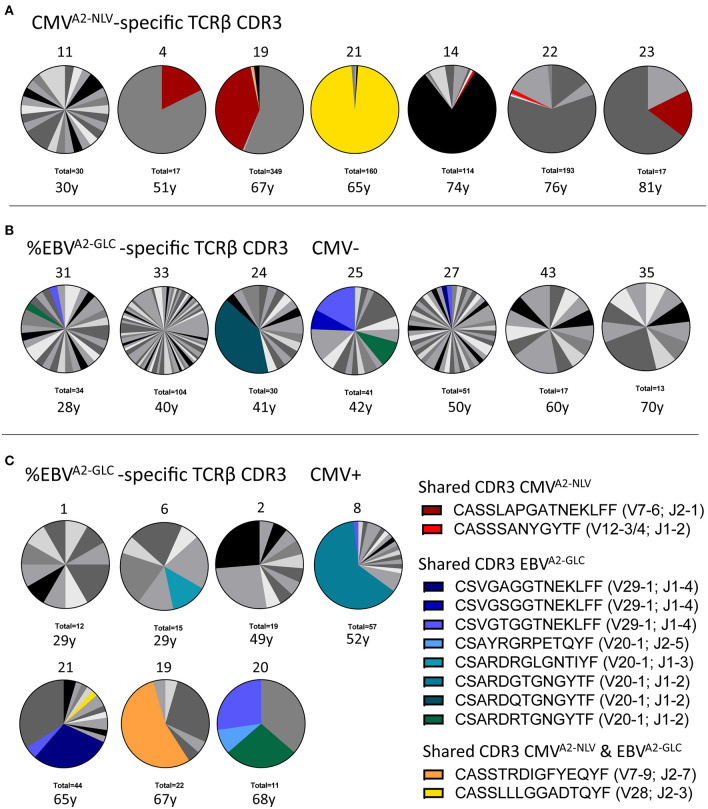
Figure 3.
Characterization of the antigen-specific TCRβ repertoire. (A) Distribution of TCRβ sequences in samples of CMVA2−NLV-specific CD8+ T cells (n = 7). (B,C) T-cell repertoire of EBVA2−GLC-specific CD8+ T cells of both CMV− (B) and CMV+ individuals (C). Each pie depicts the repertoire of a different sample, with its Donor ID on top and the total number of UMI-TCR pairs identified at the bottom, as well as the individual's age. Colors represent shared TCRβ sequences between donors. Gray scales depict unique TCRβ sequences. Note two shared sequences between the CMVA2−NLV and EBVA2−GLC sample of two single individuals (yellow and orange). As this sharing was limited to these single donors and involved a very abundant TCRβ in either one of the samples, we expect that this overlap occurred during the sorting of the cells, probably due to unspecific binding of the dextramer.

