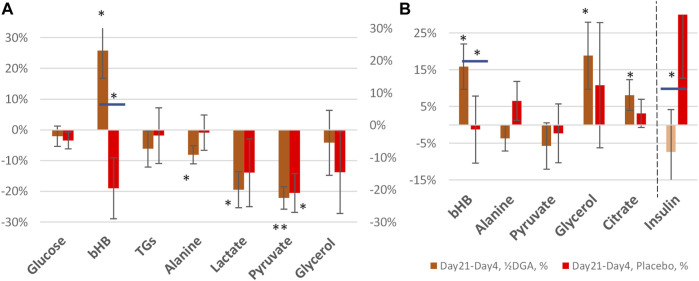
FIGURE 4.
21 days (A) and 14 days (B) %-changes in selected plasma energy metabolites and insulin. Statistical tests are based on intra-individual changes. In Figure 4A the changes are from Day 0 and in Figure 4B from Day 4. Horizontal bars in bHB and Insulin indicate statistically significant deviation between the placebo and DGA subgroups.

