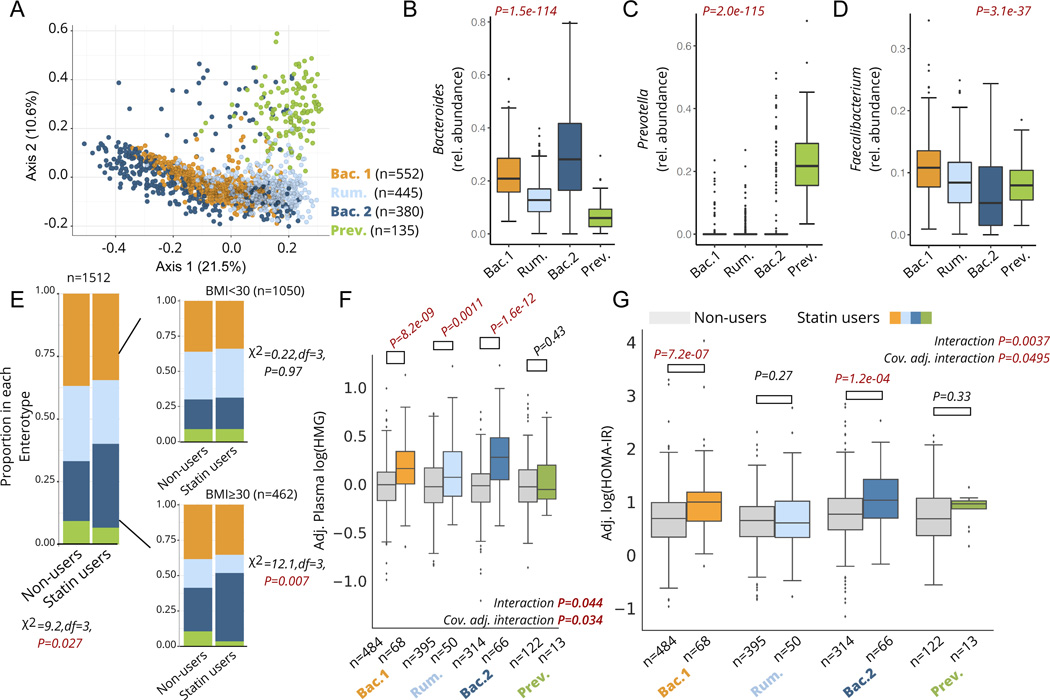
Figure 3. Statin associations with markers of efficacy and metabolic adverse effects are microbiome-dependent.
A) Principle Coordinate Analysis (PCoA) plot of the genus-level Bray-Curtis Dissimilarity matrix color-coded by enterotypes. B-D) Relative abundance of Bacteroides (B), Prevotella (C), and Faecalibacterium (D) genera across the four enterotypes identified in the cohort. E) Proportion of each enterotype in statin users and non-users across the whole cohort (left) and stratified by obesity (right). F) Plasma HMG levels among statin users and non-users stratified by enterotype. Interaction P corresponds to the statin*enterotype interaction term p-value from unadjusted ANOVA models, while the cov. Adj. interaction P corresponds to the statin-by-enterotype interaction term p-value from covariate adjusted ANCOVA models. Plasma HMG levels shown on the y-axis are values adjusted for the same covariates (residuals). G) HOMA-IR measures among statin users and non-users stratified by enterotype. Interaction P corresponds to the statin-by-enterotype interaction term p-value from unadjusted ANOVA models, while the cov. Adj. interaction P corresponds to the statin-by-enterotype interaction term p-value from ANCOVA models adjusted for covariates. P-values above the box plots in F) and correspond to tests of significance between statin non-users and statin users within each enterotype using two-samples t-test. Differences with Bonferroni corrected P<0.05 were considered statistically significant and are highlighted in red. Box plots represent the interquartile range (25th to 75th percentile, IQR), with the middle line denoting the median; whiskers span 1.5 × IQR, points beyond this range are shown individually.

