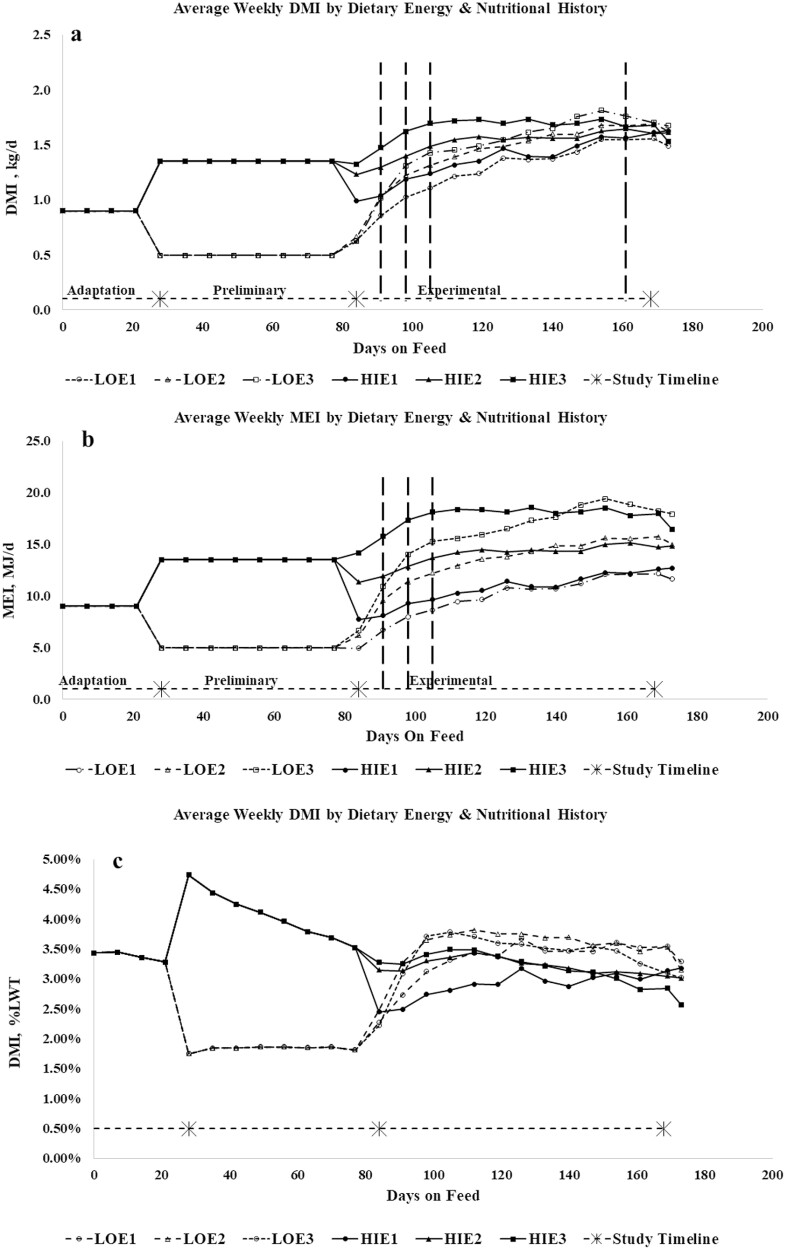
Figure 2.
Weekly average DMI (kg/d) (a), MEI (MJ/d) (b), and DMI as a percentage of liveweight (DMI %LWT) (c), and by nutritional history and energy intake during the entire study (RUP not shown). Vertical dashed lines indicate point at which intakes converged and there were no significant (P > 0.05) differences between lambs of differing nutritional histories sharing the same dietary energy density (i.e., LOE1 and HIE1).

