
Fig. 1.
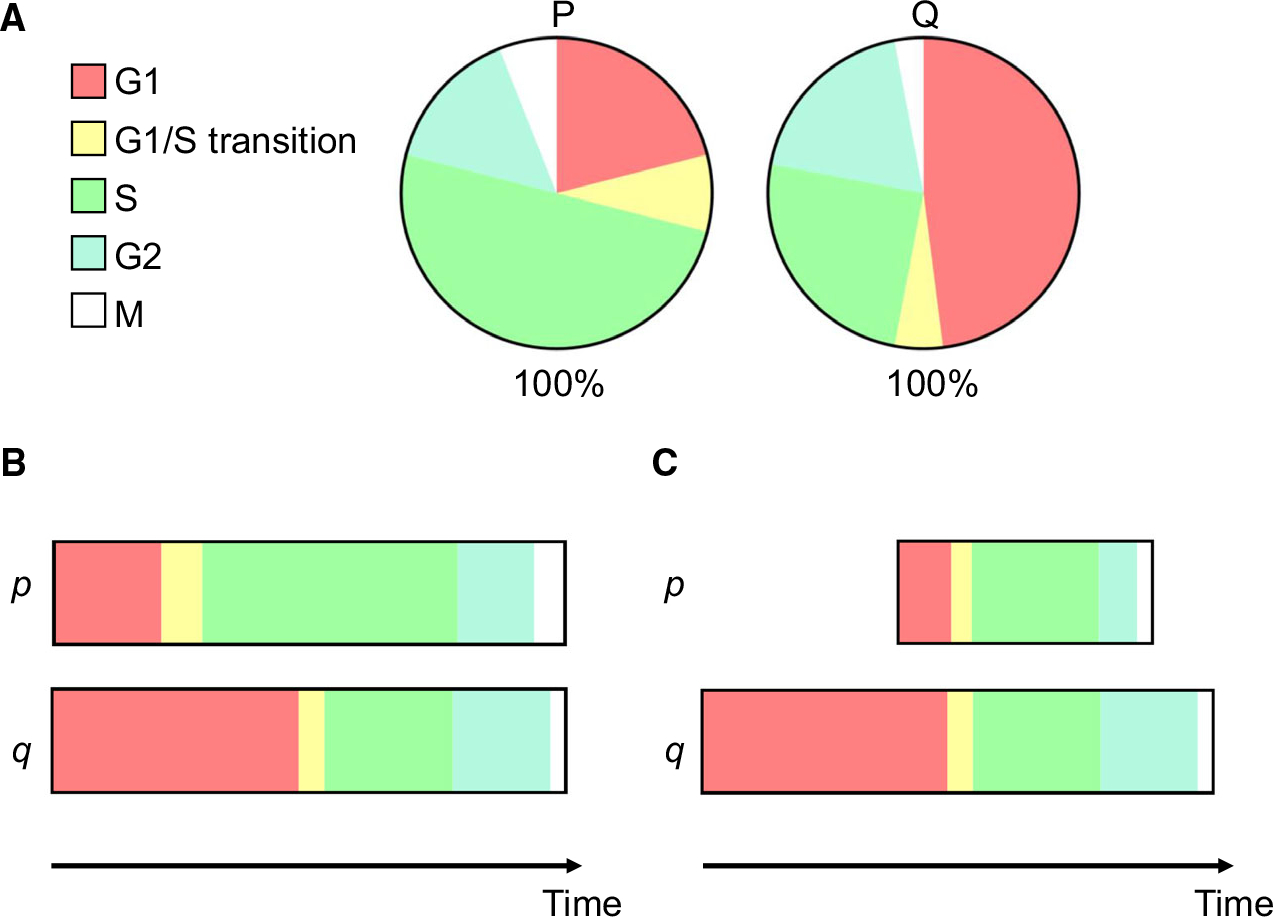
Interpreting dynamics from cell cycle phase distribution with ergodic assumptions. (A) Pie charts showing the percentage of cells identified in each phase of the cell cycle at a single moment in time in two populations, P and Q. When P and Q’s individual cellular constituents, p and q, cycle asynchronously with homogenous kinetics, the cell cycle phase distribution of P and Q reflects the relative duration of each phase within the total interval of a single cell cycle. (B) If P and Q have equivalent doubling times, then differences in p and q’s transit time through each phase can be imputed from differences in population fractions as in (A). (C) Alternatively, if the duration of a particular phase (e.g., S) is known to be equivalent in P and Q, then (A) infers differences in the total cell cycle length of p and q.