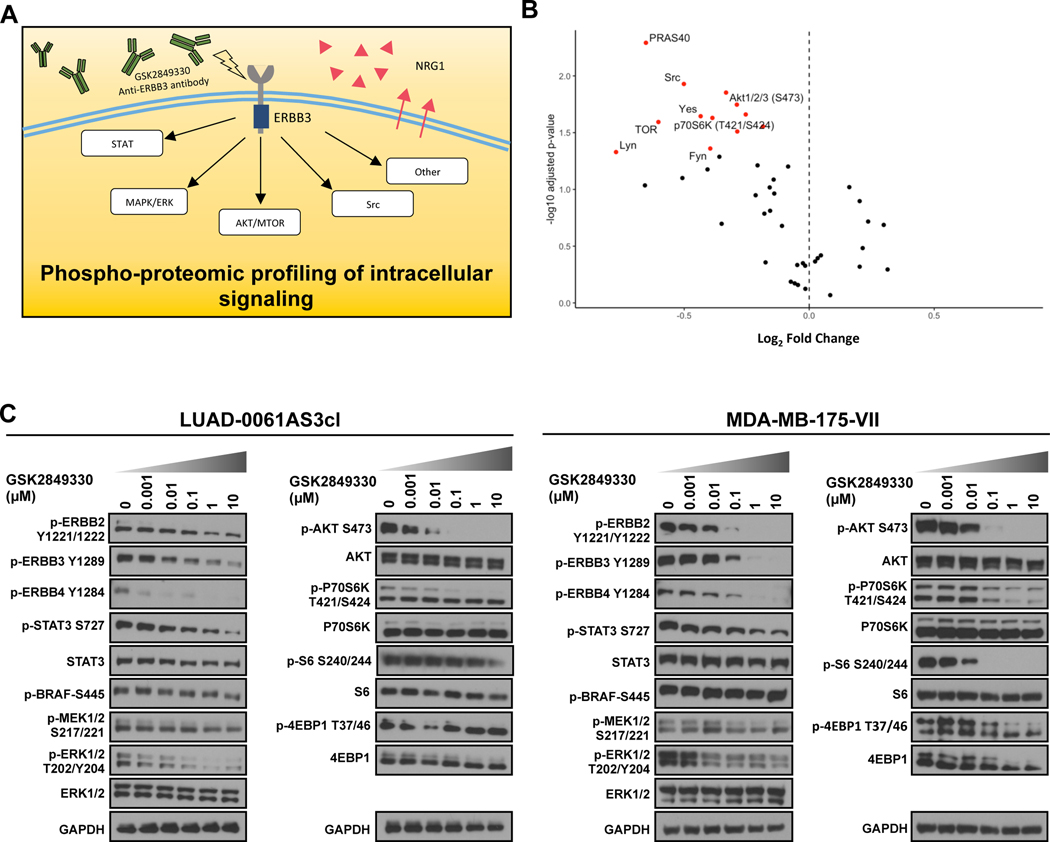
Figure 4. Phospho-proteomic profiling of intracellular signaling pathways.
A. Schematic outline of the experiment. B. Volcano plot of phospho-kinase array data obtained in LUAD-0061AS3 cells treated with 1 μM GSK2849330 for 3 h. The points that reached significance (alpha = 0.05) are highlighted in red. AKT-MTOR and SRC pathway effectors are labeled. C. Western blot validation of protein kinase array results in LUAD-0061AS3 (left) and MDA-MB-175-VII (right) cells lines. Cells were treated for 3 h with GSK2849330 and then extracts prepared for Western blotting. Representative immune blots from two independent experiments are shown.

