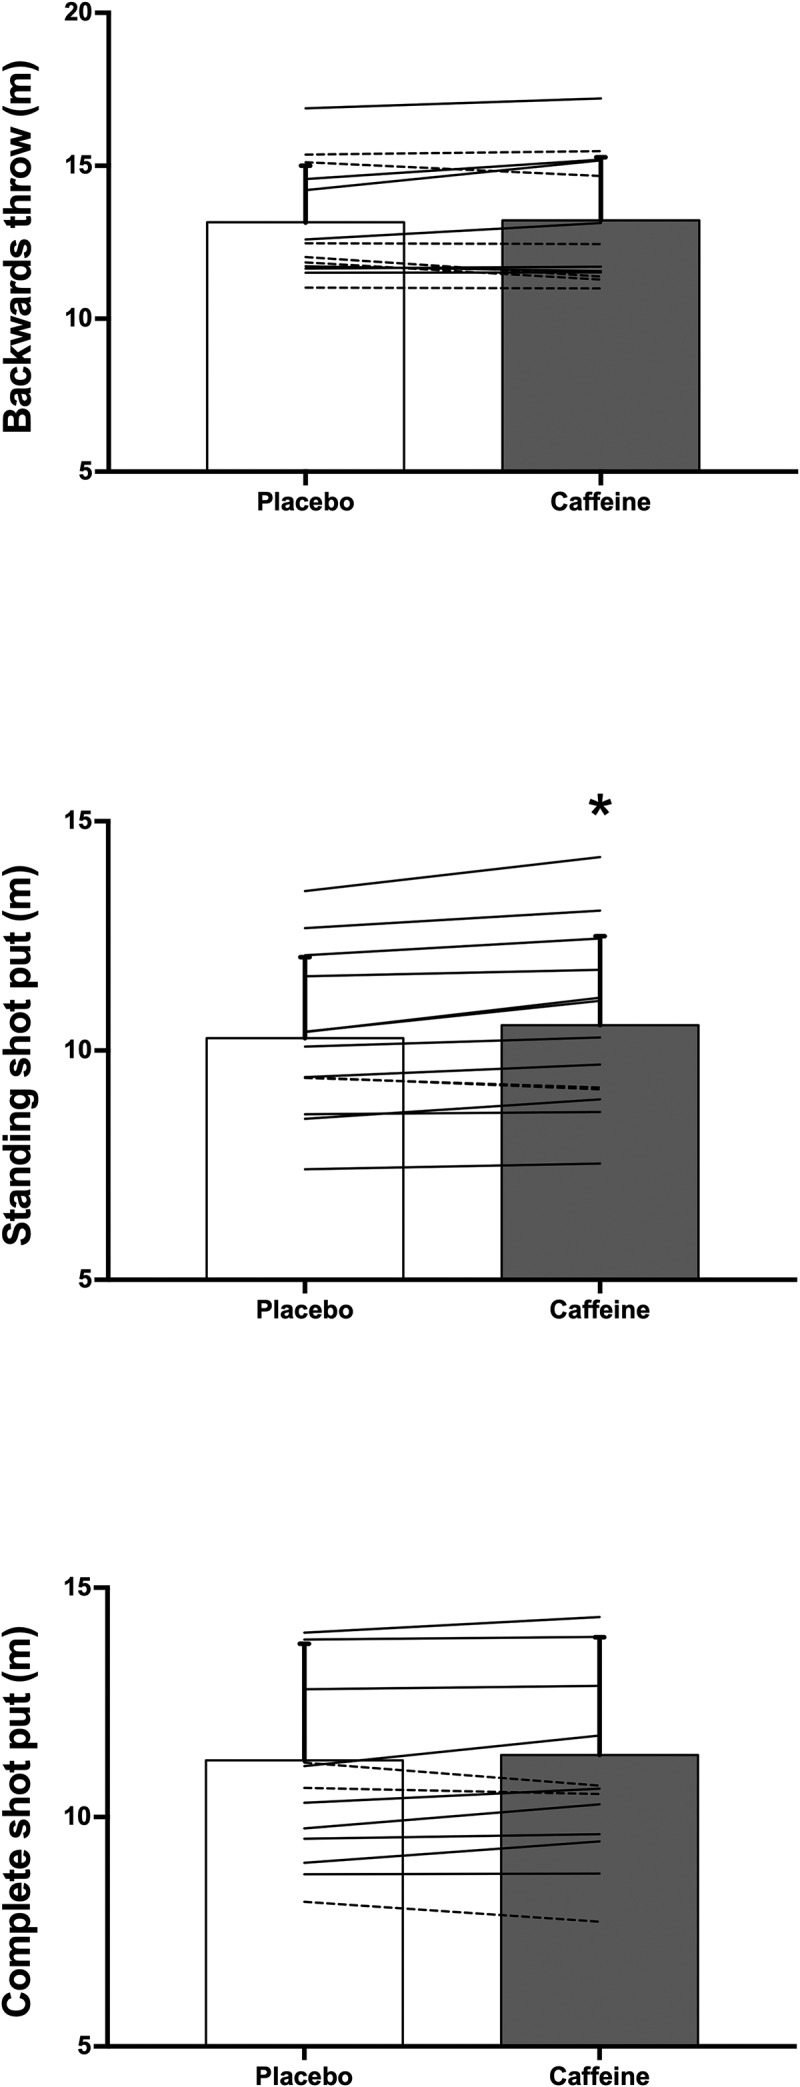
Figure 1.

Individual responses for distance (m) during of the shot-put with different methods after the ingestion of 3 mg/kg/b.m. of caffeine or a placebo. Each line represents one individual from a sample of 13 individuals; continuous lines depict individuals who increased the caffeine distance with respect to placebo and the dashed line depicts the individual with decreased the caffeine distance with respect to placebo. (*) Significant differences between caffeine and placebo at p < 0.050.
