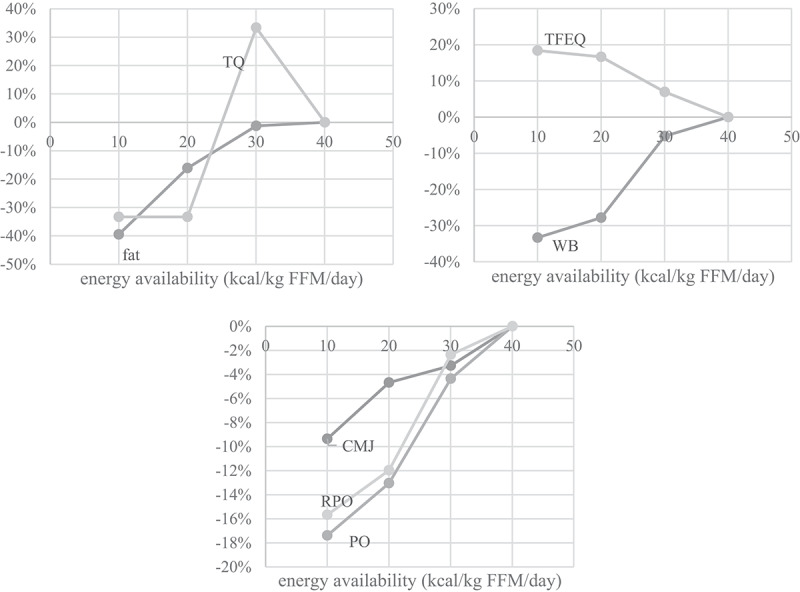
Figure 2.

Effects of reduced EA on body fat % (fat) and testosterone quartile reference range (TQ, top left), on mental state as assessed by the Three Factor Eating Questionnaire (TFEQ-R18) and Well-being questionnaire (WB, top right) and on performance as measured by the countermovement jump (CMJ), relative power output (RPO) and power output (PO, bottom) in a representative athlete. The differences are expressed in percent relative to values acquired before the intervention.
