Figure 3.

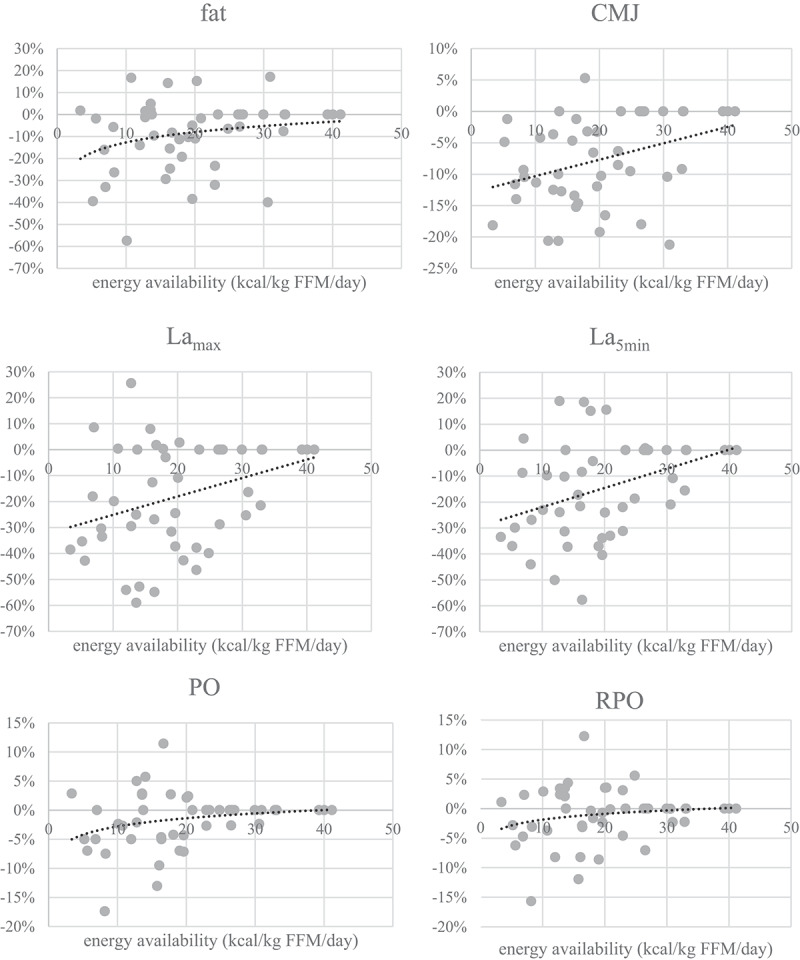
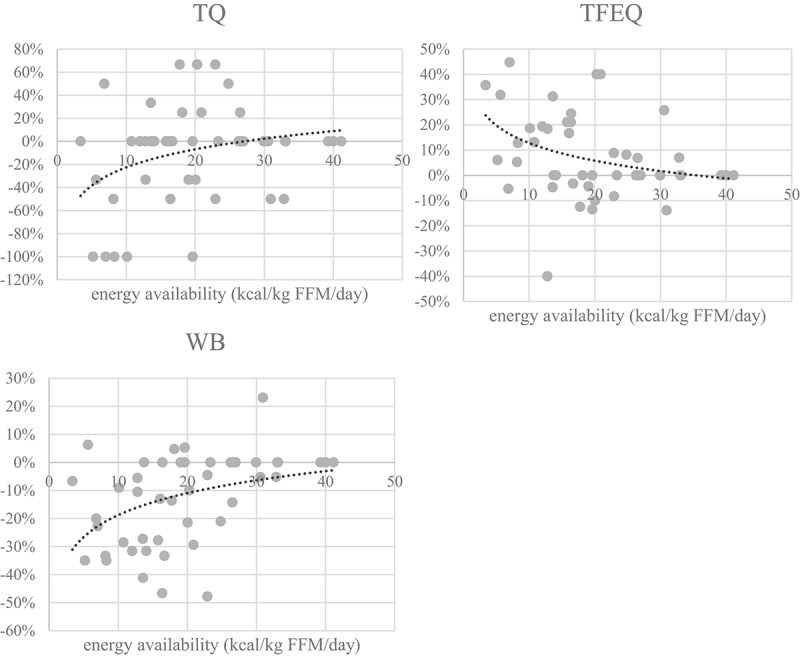
Changes of anthropometric, performance, psychological and blood parameters at different EA values. All changes are expressed relative to values before the intervention in percent (fat=body fat percent, CMJ=countermovement jump, PO=power output, RPO=relative power output, Lamax=lactate concentration at the end of the incremental test, La5min=lactate concentration 5 minutes after the end ofthe incremental test, WB=well-being questionnaire, TFEQ-R18=the Three Factor Eating Questionnaire,TQ=testosterone reference range quartile).
Figure 3.

Changes of anthropometric, performance, psychological and blood parameters at different EA values. All changes are expressed relative to values before the intervention in percent (fat=body fat percent, CMJ=countermovement jump, PO=power output, RPO=relative power output, Lamax=lactate concentration at the end of the incremental test, La5min=lactate concentration 5 minutes after the end ofthe incremental test, WB=well-being questionnaire, TFEQ-R18=the Three Factor Eating Questionnaire,TQ=testosterone reference range quartile).
