Figure 3.

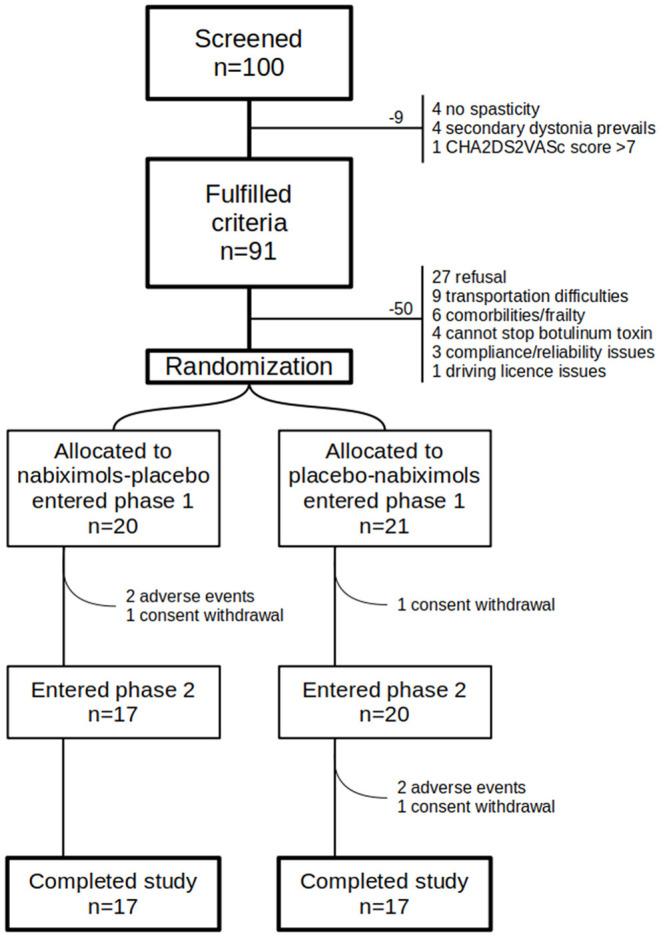
Participants flow diagram. Graphical representation of patients flow. Many patients fulfilled inclusion/exclusion criteria but had to be excluded because of many reasons, mainly refusal.

Participants flow diagram. Graphical representation of patients flow. Many patients fulfilled inclusion/exclusion criteria but had to be excluded because of many reasons, mainly refusal.