Fig. 1.
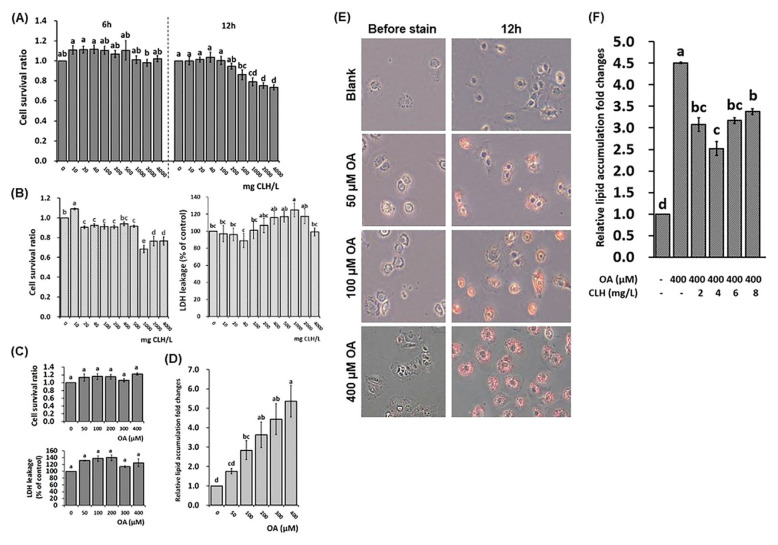
Cell survival assay, lactic acid dehydrogenase (LDH) leakage assay, and lipid accumulated model of FL83B cells. (A) Cell survival assay under different chicken liver hydrolysate (CLH) concentrations on 6- and 12-h incubation, respectively. (B) Cell survival and LDH leakage assays under different CLH concentrations. (C) Cell survival and LDH leakage assays under different OA concentrations. (D) Lipid content analysis of FL83B cells by using Nile red stain under different OA concentrations. The cultural conditions were as stated above in part (B). (E) Lipid stain by using Oil Red O stain under different OA concentrations. (F) Lipid content analysis of FL83B cells treated with 400 μM OA and different CLH concentrations by using Nile red stain. The data are given as mean ± SEM (n = 6). In part (A), data bars without a common letter in 6-h and 12-h incubation, respectively, indicate a significant difference (p < 0.05). In contrast, the other data bars in each test parameter without a common letter indicate a significant difference ( p < 0.05). Each value of the treatment was adjusted with its control. In part (A), the assay was based on the ATCC's cultural guideline (F12K medium with 10% FBS). Other assays were based on the F12K medium without FBS under 12-h incubation.

