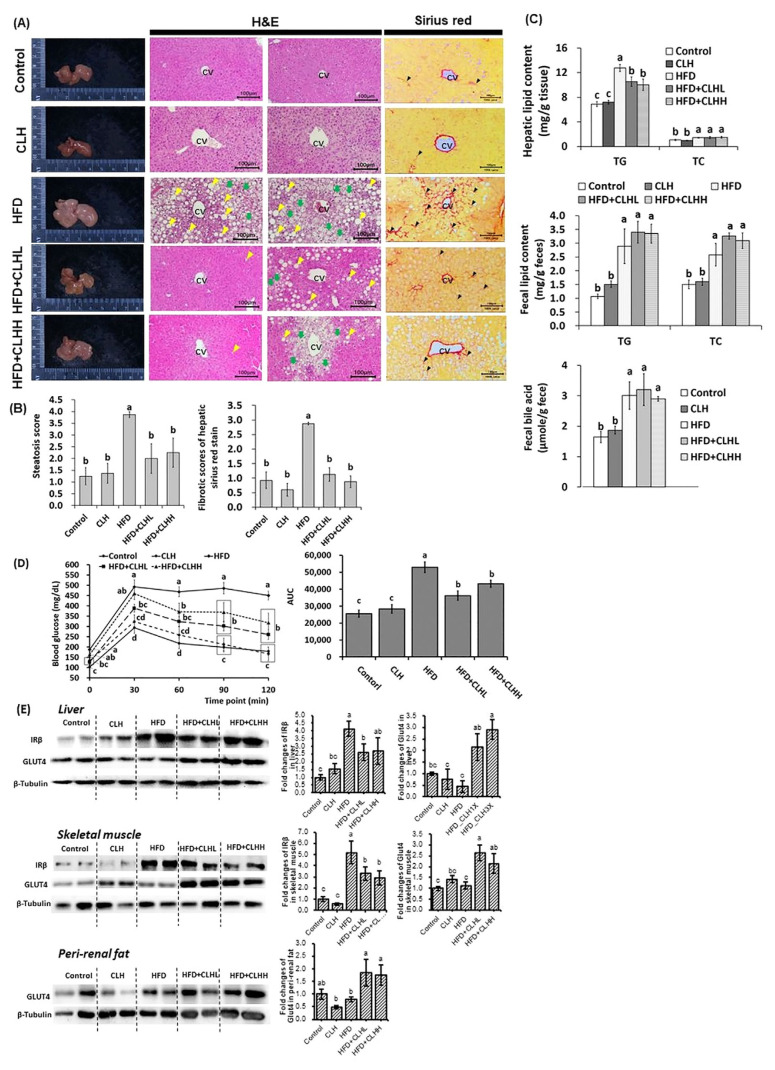
Fig. 3.
The pathohistological analyses in liver tissues, hepatic lipid, fecal lipid/bile acid profiles, ipGTT, and protein expressions in the liver, skeletal muscle, and peri-renal fat tissues of experimental mice. (A) Appearances, and H&E and Sirius red stain of liver tissues were shown. The histological photomicrographs were displayed with 100 × magnification. The scale bar was established in the bottom right corner of each image. The yellow and green arrowheads indicate macrosteatosis and microsteatosis, respectively, and the black arrowheads indicate the fibrotic scar. CV means a central vein. (B) The quantification was conducted via the respective histological grading system. The data are given as mean ± SEM (n = 8 for H&E stain; n = 4 for Sirius red stain). Data bars in steatosis or fibrotic scores without a common letter are significantly different ( p < 0.05). (C) Hepatic lipid and fecal lipid/bile acid of experimental mice at the end of the experiment. The data are given as mean ± SEM (n = 8). Data bars in each test parameter without a common letter are significantly different ( p < 0.05). (D) The glucose tolerance test was conducted via intraperitoneal injection. The AUC was calculated, and the results were shown via the bar chart. Data are given as mean ± SEM (n = 8). Data points of each time point and bars of AUC without a common letter are significantly different, respectively ( p < 0.05). (E) The illustration and quantification of proteins related to insulin signals in the liver, skeletal muscle, and peri-renal fat tissues, respectively. The data are given as mean ± SEM (n = 8). Data bars in each target protein without a common letter are significantly different ( p < 0.05).

