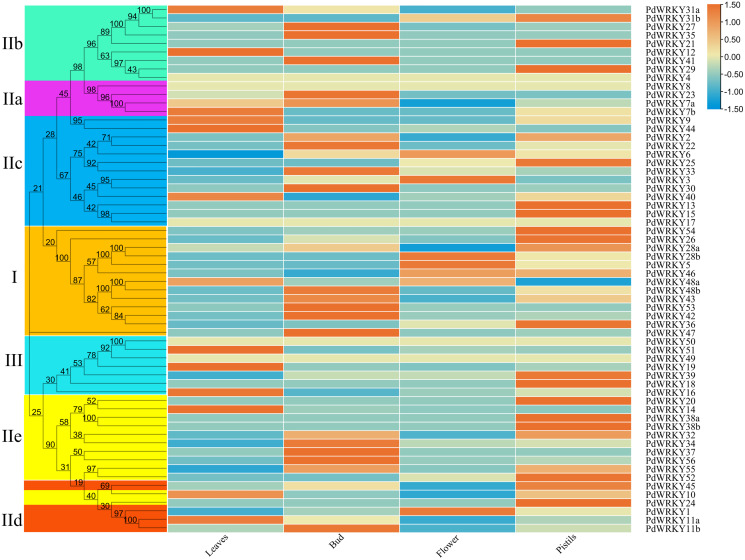
Figure 7. Expression patterns of PdWRKY genes in leaves, buds, flowers and pistils during almond development.
The ROW normalization method was used to draw the heatmap. Red squares indicate up-regulation of expression, white square means no expression, green squares indicate down-regulated expression.

