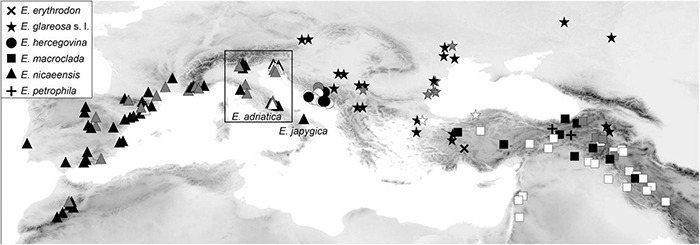
FIGURE 1.

Distribution of Euphorbia nicaeensis alliance populations sampled and used in this study. Black symbols indicate populations used in genetic (RADseq and/or ITS) and, mostly, also, in relative genome size (RGS) and morphometric analyses. Grey symbols indicate additional populations used in RGS and/or morphometric analyses; white symbols indicate populations used only in morphometric analyses. The corresponding population numbers are presented in Supplementary Figure 1, and details are given in Supplementary Table 1. Euphorbia adriatica and E. japygica have been previously included in E. nicaeensis but are, based on our results, independent species.
