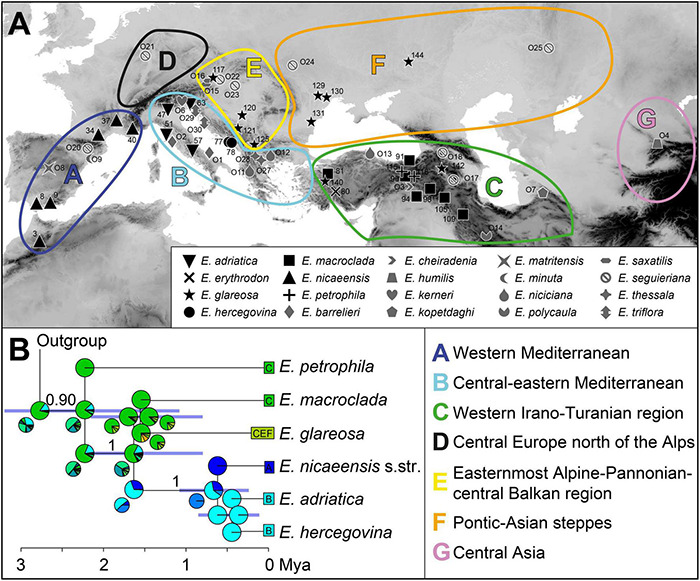
FIGURE 2.

(A) Geographic areas and geographic provenance of the investigated populations. (B) The time-calibrated species tree inferred with SNAPP and used in the biogeographic analysis with BioGeoBEARS. Numbers above branches are posterior probabilities > 0.80, and the horizontal bars correspond to 95% highest posterior densities (HPD) for the age estimates. Pie charts at each node show the marginal probabilities of alternative ancestral ranges obtained from the BioGeoBEARS analysis under the DEC + J model. In addition, smaller pie charts resulting from the DEC model are presented in cases where the reconstruction between the models differed. Colours in pie charts correspond to the geographic areas in A. The trees, including outgroup taxa, are presented in Supplementary Figure 3. Population numbers correspond to Supplementary Table 1.
