
Extended Data Figure 7. Clustering of astrocyte cells from both WT and 5xFAD mice across ages.
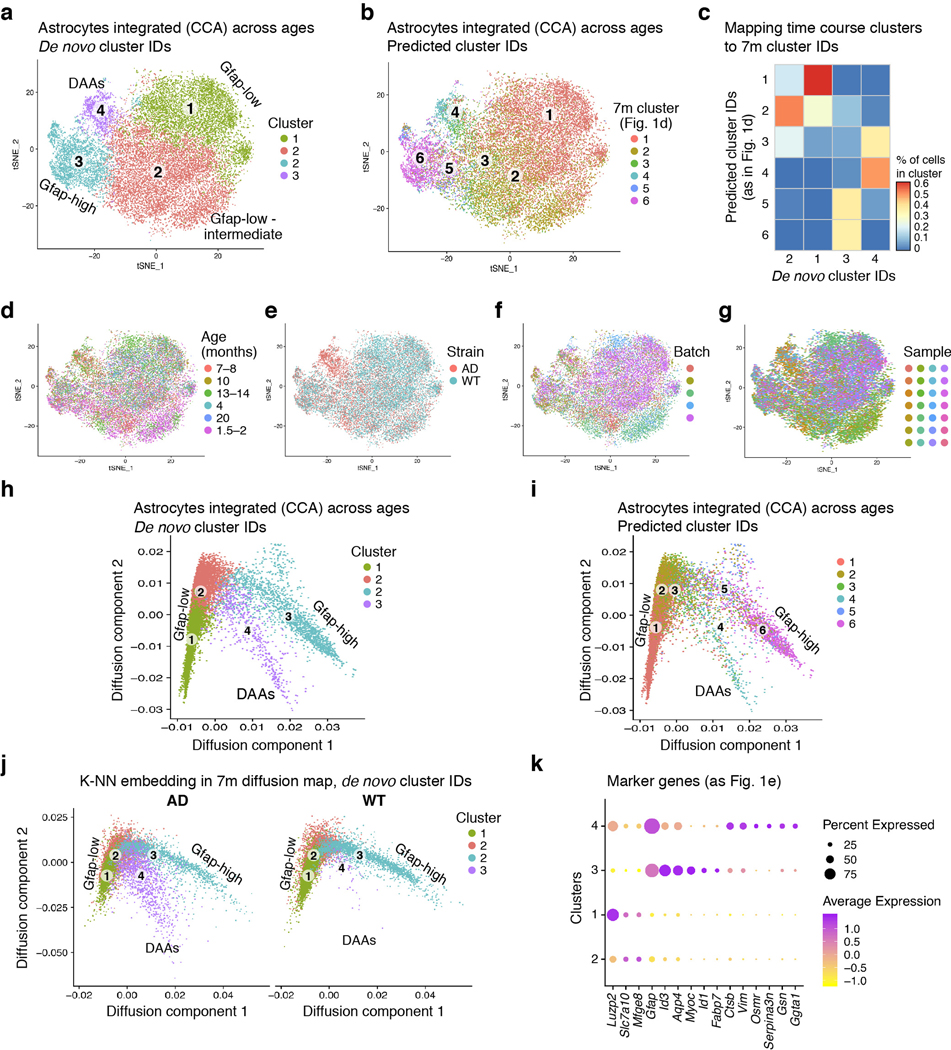
(a-b) A map of astrocyte states in WT and AD across ages. 2-D tSNE embedding of sNuc-Seq profiles of astrocytes in WT and 5xFAD (AD) mice across 6 different age groups (in months): 1.5–2 (n=6 mice), 4–5 (n=4), 7–8 (n=8), 10 (n=2), 13–14 (n=6), and 20 (n=2, WT only). (23,863 cells, from four batches, united by CCA integrated analysis5,6, Methods). Colored by: cluster IDs (in (a)), or predicted cluster IDs (using reference cluster IDs of astrocytes of 7-month old mice as in Fig. 1d, in (b)). (c) The correspondence between the de novo cluster IDs (columns) of the time course data, and the predicted cluster IDs (rows) from astrocytes of 7-month old mice (as in Fig. 1d). Color scale = proportion of predicted IDs per de novo cluster. (d-g) 2-D tSNE embedding of time course astrocytes as in (a), colored by: age (d), mouse strain, AD/WT (e), batch (f), or sample (g). (h) Continuous trajectory of astrocyte states across ages in WT and AD. 2-D diffusion map embedding of astrocytes across ages. Colored by de novo clusters: Gfap-low (1), Gfaplow/ intermediate (2), Gfap-high (3), and DAAs (4). 15,113 astrocyte cells, down sampled randomly from 23,863 cells to capture 2,500 cells of each age group (or the maximum number of cells available if less than 2,500). (i) 2-D diffusion map embedding (as in (h)), colored by predicted cluster IDs (as in (b)). (j) 2-D embedding of the 15,113 astrocytes of AD (left) and WT (right) cells across ages, projected onto the diffusion map of 7-month old mice (embedded by the weighted average position of the K-NN in the diffusion map in Fig. 1d, Methods). Colored by the de novo clusters (as in (a)). (k) The expression level (as color scale) and the percent of cells expressing (as dot size) of marker genes for DAAs (Ggta1, Gsn, Osmr, Vim, Serpina3n, Ctsb, and Gfap), Gfaphigh (Fabp7, Slc38a1, Myoc, Aqp4, Id1, Id3, and Gfap) and Gfap-low (Mfge8, Slc7a10, Luzp2), across de novo clusters of astrocytes in the time course dataset.