
Figure 2. DAAs are associated with diverse molecular pathways and positioned in proximity to Aβ plaques in AD.
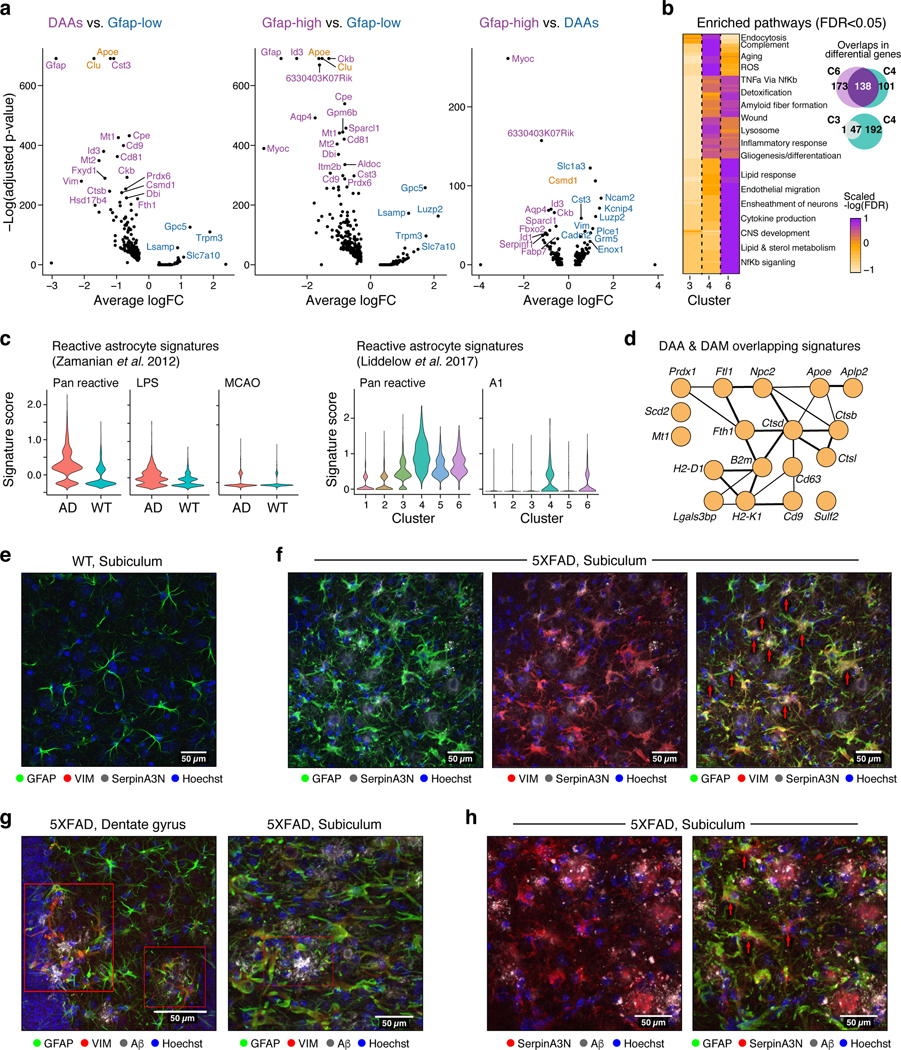
(a) Multiple genes upregulated in DAAs and Gfap-high compared to Gfap-low astrocytes (total 7,345 astrocytes across states). Volcano plot showing differential expression of genes in each pair of states (n=8 animals; 1,594, 478 and 457 cells in clusters 1,4 and 6 respectively; negative binomial p-value, FDR correction). Y-axis: -log10(adjusted p-value) and Xaxis: average log fold change (FC). All cluster pairs in Extended Data Fig. 5a. AD risk factor genes from GWAS marked in orange. (b) Shared and distinct upregulated genes and pathways between clusters 4 (DAAs), 6 (Gfap-high) and 3 (intermediate) astrocytes compared to Gfap-low astrocytes. Left: Geatmap showing the significance of upregulated pathways in the three clusters (n=8 animals. 2265 cells in cluster 3, other cells numbers as in (a); Hypergeometric p-value, FDR<0.05. -log(FDR) values as colorbar) Selected pathway names are highlighted (full list in Extended Data Fig. 5b and Supplementary Table 3). Right: Venn diagrams of up-regulated genes (hypergeometric p-value FDR < 0.01). (c) Signatures of reactive astrocytes found in AD. Violin plots showing the distribution of expression scores (y axis) for previously defined signature genes for (left) pan-reactive, inflammation-associated (LPS), and ischemia-associated (MCAO) reactive astrocytes (from6) across WT (3,831 cells, n=4 animals) and AD (3,514 cells, n=4 animals), and (right) pan-reactive and A1-reactive astrocytes (from5) across clusters (n=8 mice, 10 samples, Extended Data Fig. 6a-c). (d) Overlapping upregulated genes between disease-associated microglia (DAM)1 and DAA. 18 shared genes (nodes), connected by functional links (edges), weighted (edge width) proportionally to the confidence levels (Methods). (e-h) Astrocytes expressing DAA markers are found in AD brains, enriched in the subiculum and in proximity to Aβ plaques. Representative immunofluorescence images in sagittal sections of 7–8-month old mice. Subiculum, stained for GFAP (green), VIM (red), and serpinA3N (gray), in WT mice (e) and 5XFAD mice (f). Dentate gyrus (g, left) and subiculum (g, right), stained for GFAP (green), VIM (red), and Aβ (gray) in 5XFAD mice. Subiculum, stained for GFAP (green), serpinA3N (red), and Aβ (gray) in 5XFAD mice (h). Cell nuclei are shown in blue (Hoechst). Scale bar, 50 μ m. Red arrows or red boxes: colocalization of three proteins. Experiments repeated on 4 brain slices per animal on n=4 AD and WT mice.