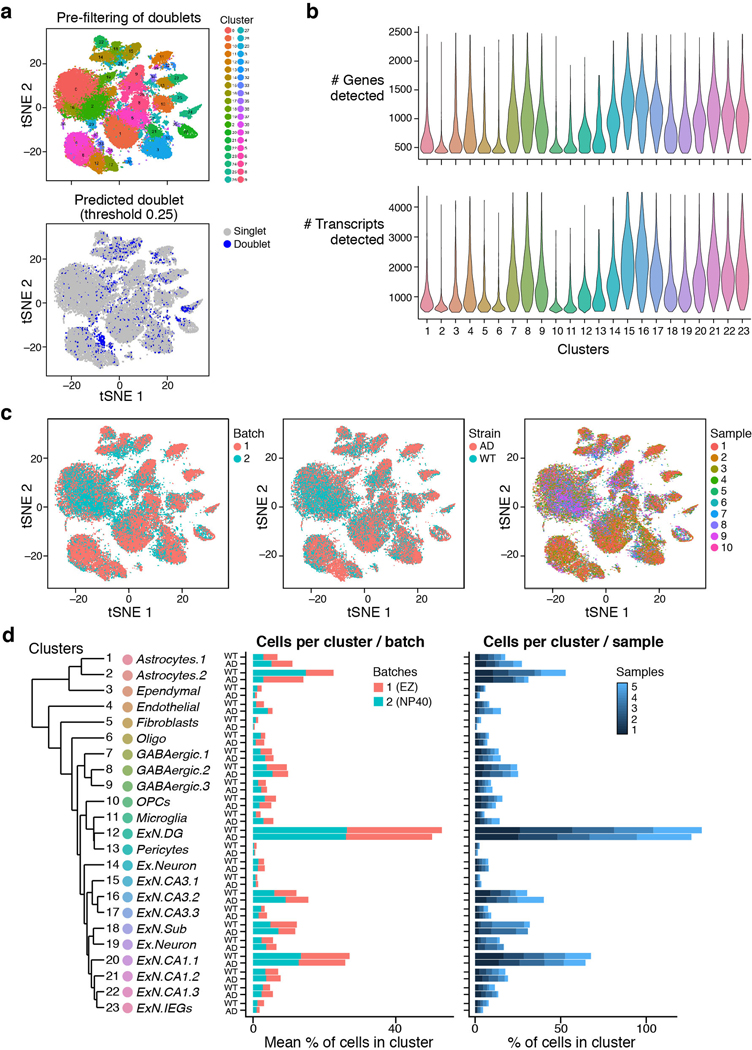
Extended Data Fig. 1. A cellular map of the mouse hippocampus of WT and 5xFAD mice and quality controls.
(a) Doublet detection and elimination. 2-D tSNE embedding of 60,818 single nuclei RNA profiles from hippocampus of four WT and four 5xFAD 7- month old mice, before filtration. Top: Color coded by cluster assignment. Bottom: Color coded by doublet score assigned per cell by the Scrublet1 software, used to infer doublet cells and clusters to exclude from the analysis. (b) Number of genes and transcripts across clusters. Violin plots showing the distribution of number of genes (top) and transcripts (unique UMIs, bottom) detected in each cluster (n=8 mice, 10 samples). Cluster numbers as in Fig. 1b. (c) 2-D tSNE embedding of single nuclei RNA profiles from hippocampus of WT and 5xFAD mice (as in Fig. 1b), colored by (from left to right): batch, mouse strain (WT or AD) and sample. (d) Similar distribution of samples and batches across clusters. The percent of cells per cluster, in WT and 5xFAD mice. Middle: Colored by batch/lysis buffer (red= EZ lysis. Blue = NP40 lysis, Methods), Right: Colored by sample (blue color scale, 4 animals and 5 samples per mouse strain, AD or WT). Left: The hierarchical cluster tree and annotations of clusters, as in Fig. 1b.

